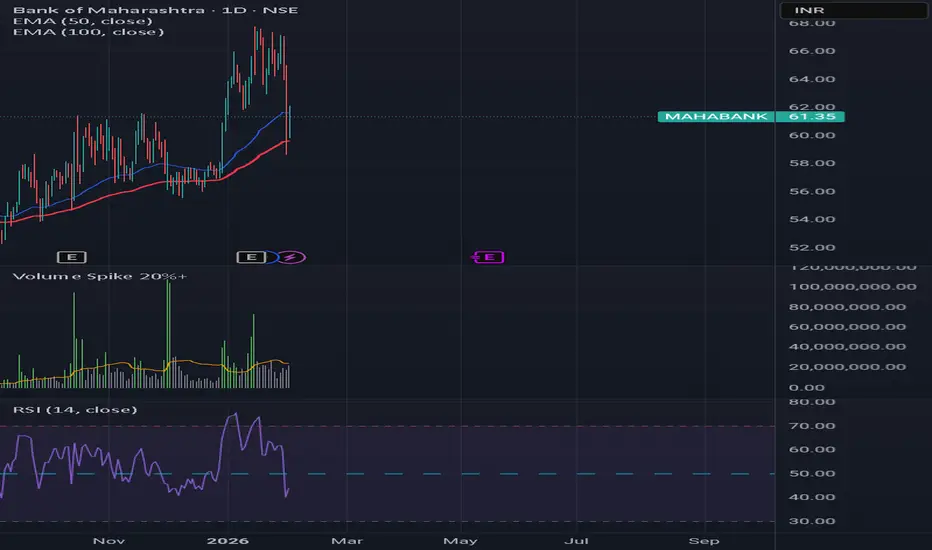
Showing support at 8t 50 days MA
RSI bounced back from its lower level (39 to 43) and becoming stronger.
MACD on monthly chart indicates share prices is preparing for longterm bet.
RSI bounced back from its lower level (39 to 43) and becoming stronger.
MACD on monthly chart indicates share prices is preparing for longterm bet.
Disclaimer
The information and publications are not meant to be, and do not constitute, financial, investment, trading, or other types of advice or recommendations supplied or endorsed by TradingView. Read more in the Terms of Use.
Disclaimer
The information and publications are not meant to be, and do not constitute, financial, investment, trading, or other types of advice or recommendations supplied or endorsed by TradingView. Read more in the Terms of Use.