Bank of Maharashtra has delivered a powerful bullish signal today, breaking out of a classic Ascending Triangle pattern on high volume. This decisive move suggests that its consolidation phase is over and a new uptrend is likely beginning.
The Setup: An Ascending Triangle
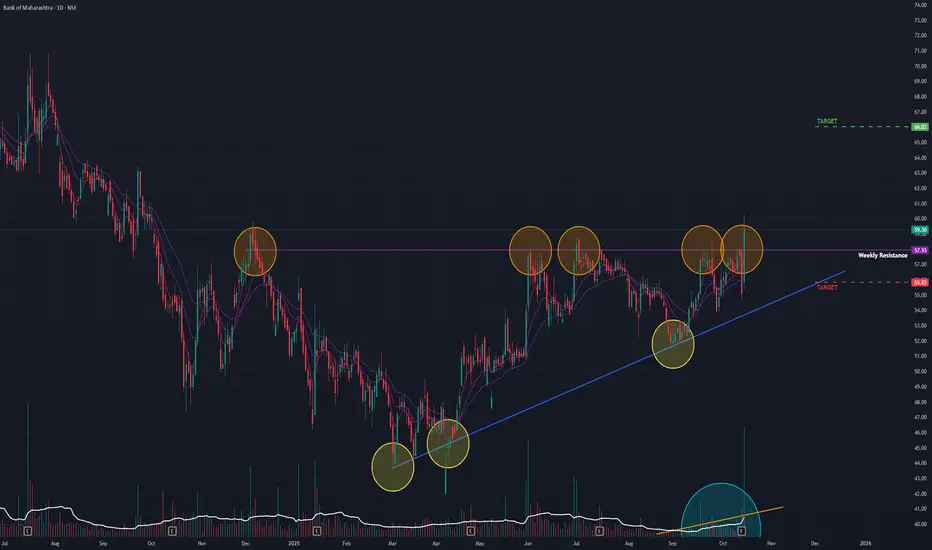
Following a prior downtrend, the stock meticulously formed an Ascending Triangle pattern. This is a classic bullish structure characterized by a series of Higher Lows consistently pushing up against a flat horizontal resistance level, which in this case, has been in place since December 2024. This pattern indicates a gradual build-up of buying pressure.
Today's Decisive Breakout
Today's session (Wednesday, October 15, 2025) confirmed the bullish outlook with authority:
- Strong Price Surge: The stock rallied by an impressive +7.60%.
- Confirmed Breakout: The price decisively broke out and, importantly, closed above the key horizontal resistance of the triangle.
- Huge Volume: The breakout occurred on huge trading volume, which provides strong confirmation and indicates significant buyer participation.
Adding to the conviction, as you noted, trading volume has been steadily increasing over the past few days, suggesting smart money was accumulating shares in anticipation of this move.
Underlying Technical Strength
The breakout is well-supported by key momentum indicators. The short-term Exponential Moving Averages (EMAs) and the Relative Strength Index (RSI) are both in a strong bullish state across the Monthly, Weekly, and Daily timeframes, indicating broad-based strength.
Outlook and Key Levels
With the bullish pattern now confirmed, the path of least resistance has shifted firmly upwards.
- Bullish Target: If the stock sustains this breakout momentum, the next logical area of resistance and potential price target is the ₹65 level.
- Bearish Target: If the stock fails the breakout momentum, it could pull back to the support level around ₹54
In conclusion, today's high-volume breakout from a classic bullish pattern is a very strong technical signal. The key now is for the price to remain above the ₹58 support level to validate the start of a new, sustained uptrend.
The Setup: An Ascending Triangle
Following a prior downtrend, the stock meticulously formed an Ascending Triangle pattern. This is a classic bullish structure characterized by a series of Higher Lows consistently pushing up against a flat horizontal resistance level, which in this case, has been in place since December 2024. This pattern indicates a gradual build-up of buying pressure.
Today's Decisive Breakout
Today's session (Wednesday, October 15, 2025) confirmed the bullish outlook with authority:
- Strong Price Surge: The stock rallied by an impressive +7.60%.
- Confirmed Breakout: The price decisively broke out and, importantly, closed above the key horizontal resistance of the triangle.
- Huge Volume: The breakout occurred on huge trading volume, which provides strong confirmation and indicates significant buyer participation.
Adding to the conviction, as you noted, trading volume has been steadily increasing over the past few days, suggesting smart money was accumulating shares in anticipation of this move.
Underlying Technical Strength
The breakout is well-supported by key momentum indicators. The short-term Exponential Moving Averages (EMAs) and the Relative Strength Index (RSI) are both in a strong bullish state across the Monthly, Weekly, and Daily timeframes, indicating broad-based strength.
Outlook and Key Levels
With the bullish pattern now confirmed, the path of least resistance has shifted firmly upwards.
- Bullish Target: If the stock sustains this breakout momentum, the next logical area of resistance and potential price target is the ₹65 level.
- Bearish Target: If the stock fails the breakout momentum, it could pull back to the support level around ₹54
In conclusion, today's high-volume breakout from a classic bullish pattern is a very strong technical signal. The key now is for the price to remain above the ₹58 support level to validate the start of a new, sustained uptrend.
Disclaimer: This analysis is my personal view & for educational purposes only. They shall not be construed as trade or investment advice. Before making any financial decision, it is imperative that you consult with a qualified financial professional.
Disclaimer
The information and publications are not meant to be, and do not constitute, financial, investment, trading, or other types of advice or recommendations supplied or endorsed by TradingView. Read more in the Terms of Use.