Maruti Suzuki: Strong Breakout and Key Support Levels – Sept 25
The Maruti Suzuki India Limited chart displays a strong upward trend with recent price action indicating a potential consolidation or pullback after a significant rally.
Technical indicators highlight important support and resistance levels, overall momentum.
Price Action & Trend
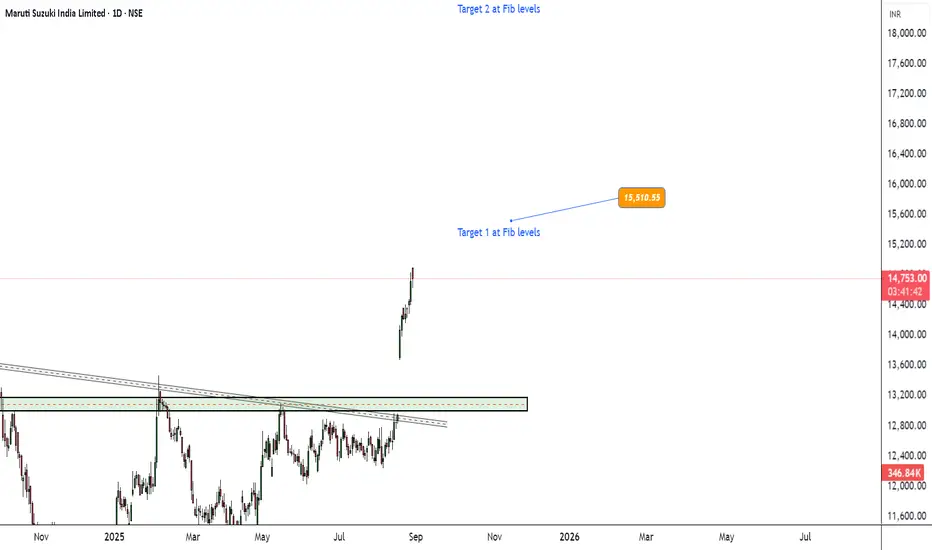
1.The price has recently surged from around ₹13,200 to a high of ₹14,754, reflecting a robust bullish move over the observed period.
2. Candlestick patterns show a sequence of higher highs and higher lows, typical of a sustained uptrend.
3. The current price is ₹14,749, slightly below the recent high, suggesting short-term profit booking or consolidation after an aggressive rally.
Volume & Signals
1.Volume has spiked during breakout points, providing confirmation for the bullish run. A recent decline in volume may suggest waning momentum or a period of consolidation.
2.The Stochastic or RSI-like oscillator is currently at 16.82, which is in the oversold territory. This could hint at an imminent reversal or a bounce if buyers regain control.
Buying Levels -
Above all time high and targets could be placed around 15,500 and 18,000.
#swingtrading
#volumeburst
#autosectorstocks
This is just a analysis and not to be considered as buy or sell. Do your analysis before taking any positions.
Happy trading.
Technical indicators highlight important support and resistance levels, overall momentum.
Price Action & Trend
1.The price has recently surged from around ₹13,200 to a high of ₹14,754, reflecting a robust bullish move over the observed period.
2. Candlestick patterns show a sequence of higher highs and higher lows, typical of a sustained uptrend.
3. The current price is ₹14,749, slightly below the recent high, suggesting short-term profit booking or consolidation after an aggressive rally.
Volume & Signals
1.Volume has spiked during breakout points, providing confirmation for the bullish run. A recent decline in volume may suggest waning momentum or a period of consolidation.
2.The Stochastic or RSI-like oscillator is currently at 16.82, which is in the oversold territory. This could hint at an imminent reversal or a bounce if buyers regain control.
Buying Levels -
Above all time high and targets could be placed around 15,500 and 18,000.
#swingtrading
#volumeburst
#autosectorstocks
This is just a analysis and not to be considered as buy or sell. Do your analysis before taking any positions.
Happy trading.
Trade active
Target 1 achieved. Now trailing can be done and hold till long term targets of 18500.Disclaimer
The information and publications are not meant to be, and do not constitute, financial, investment, trading, or other types of advice or recommendations supplied or endorsed by TradingView. Read more in the Terms of Use.
Disclaimer
The information and publications are not meant to be, and do not constitute, financial, investment, trading, or other types of advice or recommendations supplied or endorsed by TradingView. Read more in the Terms of Use.