I've had Metropolis Healthcare  METROPOLIS on my radar for a bit, and what I'm seeing now is a technical setup that's hard to ignore. It’s one of those charts where a few different analytical approaches all seem to be pointing in the same direction—a confluence that always gets my attention.
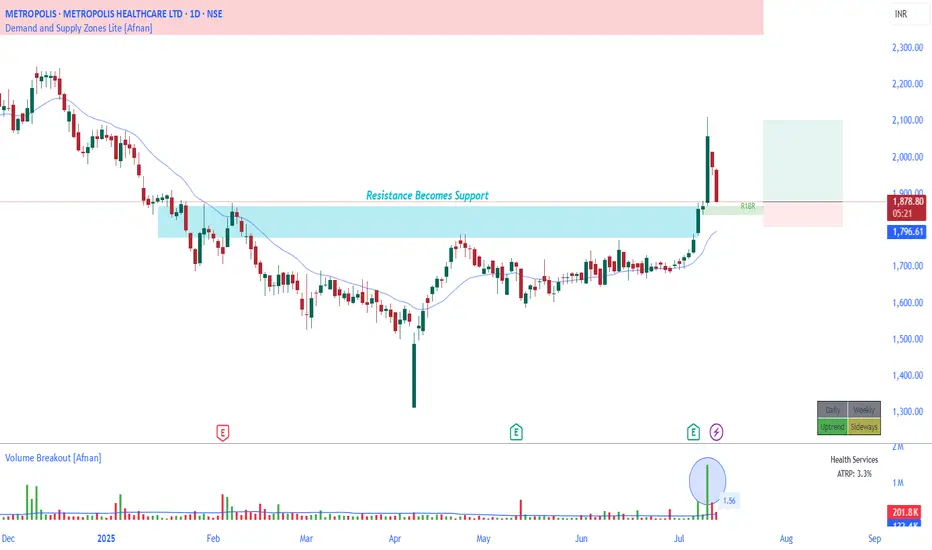
The Key Level I'm Watching
The price is currently pulling back into a well-defined Rally-Base-Rally (RBR) demand zone on the daily chart. For those who follow institutional order flow, these zones are significant. They often represent the 'footprints' of smart money—areas where large players stepped in and likely left a trail of unfilled buy orders.
Now, here’s where it gets interesting. This isn’t just any demand zone floating in space. It lines up almost perfectly with a prior resistance level that was recently broken. This is a textbook example of the polarity principle—old resistance flipping to become new support. It’s a powerful combination.
What really strengthens this setup for me is the volume signature. Look at the volume on this pullback. It’s been steadily declining, which suggests sellers are losing steam. This isn't aggressive, panicked selling; it looks more like a healthy breather before a potential move higher.
🔍 Putting It in a Broader Context
To really appreciate this setup, we have to zoom out a little. After a significant downtrend bottomed out around what looks like April, the stock went into a long consolidation phase that lasted for months, from late February into early July. This sideways action built a solid foundation where accumulation was likely taking place.
In early July, we finally saw a decisive breakout from that range on heavy, convincing volume. That action signaled a potential shift in the larger trend, and this current pullback looks like the first classic retest of that breakout area.
📝 My Takeaway 📝
So, when you pull all these threads together, you get a compelling picture. It's not about one single indicator, but how they all align.
Of course, no setup is a sure thing. The market can and will do whatever it wants, and any zone can fail. That's why a disciplined stop-loss is non-negotiable for any position built around this idea.
This is purely my analysis for educational discussion; it's not a formal trading recommendation. I am not a SEBI registered analyst, so please do your own homework before making any financial decisions.
The Key Level I'm Watching
The price is currently pulling back into a well-defined Rally-Base-Rally (RBR) demand zone on the daily chart. For those who follow institutional order flow, these zones are significant. They often represent the 'footprints' of smart money—areas where large players stepped in and likely left a trail of unfilled buy orders.
Now, here’s where it gets interesting. This isn’t just any demand zone floating in space. It lines up almost perfectly with a prior resistance level that was recently broken. This is a textbook example of the polarity principle—old resistance flipping to become new support. It’s a powerful combination.
What really strengthens this setup for me is the volume signature. Look at the volume on this pullback. It’s been steadily declining, which suggests sellers are losing steam. This isn't aggressive, panicked selling; it looks more like a healthy breather before a potential move higher.
🔍 Putting It in a Broader Context
To really appreciate this setup, we have to zoom out a little. After a significant downtrend bottomed out around what looks like April, the stock went into a long consolidation phase that lasted for months, from late February into early July. This sideways action built a solid foundation where accumulation was likely taking place.
In early July, we finally saw a decisive breakout from that range on heavy, convincing volume. That action signaled a potential shift in the larger trend, and this current pullback looks like the first classic retest of that breakout area.
📝 My Takeaway 📝
So, when you pull all these threads together, you get a compelling picture. It's not about one single indicator, but how they all align.
- A High-Probability Zone: We have a fresh demand zone overlapping perfectly with a classic support/resistance flip level.
- Volume Confirmation: The initial breakout happened on strong volume, while the current pullback is on weak volume—exactly what bulls want to see.
- Favorable Risk/Reward: From a trade management perspective, an entry near this level offers a clear-cut location for a stop-loss just below the zone, creating a potentially attractive risk-to-reward profile.
The setup gets you in the game, but risk management is what lets you stay in it.
Of course, no setup is a sure thing. The market can and will do whatever it wants, and any zone can fail. That's why a disciplined stop-loss is non-negotiable for any position built around this idea.
This is purely my analysis for educational discussion; it's not a formal trading recommendation. I am not a SEBI registered analyst, so please do your own homework before making any financial decisions.
Trade closed: target reached
Access the powerful Demand and Supply Zone Pro indicator at:
marketup2date.com
Stay updated on Telegram:
t.me/MarketUp2Date
Join our WhatsApp channel:
whatsapp.com/channel/0029Va6ByyH0LKZCc4Az4x0u
marketup2date.com
Stay updated on Telegram:
t.me/MarketUp2Date
Join our WhatsApp channel:
whatsapp.com/channel/0029Va6ByyH0LKZCc4Az4x0u
Disclaimer
The information and publications are not meant to be, and do not constitute, financial, investment, trading, or other types of advice or recommendations supplied or endorsed by TradingView. Read more in the Terms of Use.