Let's start by looking at the weekly timeframe chart...

➖ An ATH was hit in July but the candle in which the ATH hit closed red and this preceded a correction.
➖ A new All-Time High hit last month with the candle again closing red, which opens the door for a new but stronger correction. These are early signals.
➖ The weekly RSI is showing a 2 year strong bearish divergence, it peaked November 2021 while the stock peaked November 2023.

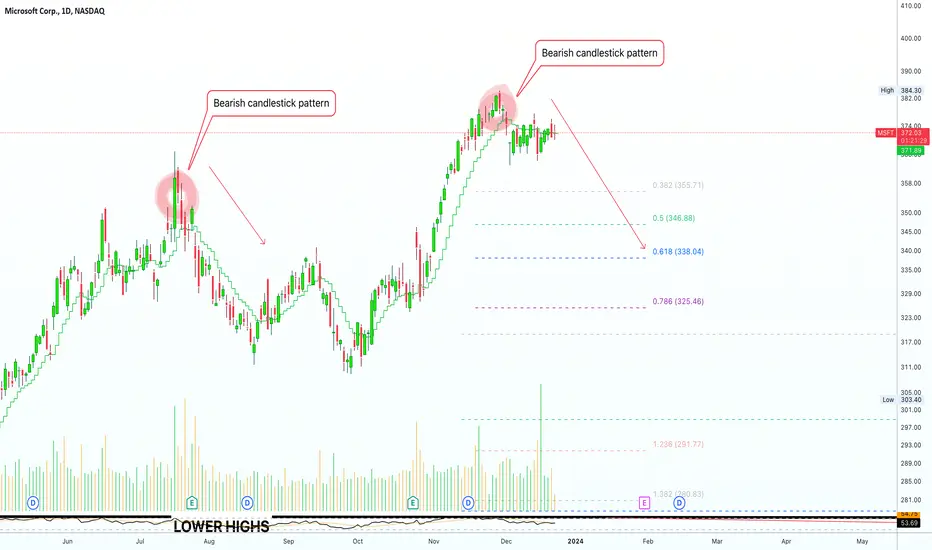
➖ On the daily timeframe MSFT still trades above EMA10 but a recent bearish candlestick pattern showed up after the new ATH.
➖ We have really high buy volume 15-Dec but prices failed to move higher, a sign of weakness.
There is potential for a drop.
Additional confirmation is needed, is still very early but the bullish trend is losing momentum.
Namaste.
➖ An ATH was hit in July but the candle in which the ATH hit closed red and this preceded a correction.
➖ A new All-Time High hit last month with the candle again closing red, which opens the door for a new but stronger correction. These are early signals.
➖ The weekly RSI is showing a 2 year strong bearish divergence, it peaked November 2021 while the stock peaked November 2023.
➖ On the daily timeframe MSFT still trades above EMA10 but a recent bearish candlestick pattern showed up after the new ATH.
➖ We have really high buy volume 15-Dec but prices failed to move higher, a sign of weakness.
There is potential for a drop.
Additional confirmation is needed, is still very early but the bullish trend is losing momentum.
Namaste.
🚨 Get the FULL (6-in-1) PREMIUM PACKAGE
lamatrades.com —Since 2017
🚨 TOP Results: ZEC +2736% · ETH +2150%, CRO +1272%, AAVE +1134%, DOGS +868%, SOL +861%, XRP +749%, BTC +580%
More 👉 t.me/masteranandatrades/6681
lamatrades.com —Since 2017
🚨 TOP Results: ZEC +2736% · ETH +2150%, CRO +1272%, AAVE +1134%, DOGS +868%, SOL +861%, XRP +749%, BTC +580%
More 👉 t.me/masteranandatrades/6681
Related publications
Disclaimer
The information and publications are not meant to be, and do not constitute, financial, investment, trading, or other types of advice or recommendations supplied or endorsed by TradingView. Read more in the Terms of Use.