📢 Title: NAS100USD Bullish Reversal: Gap Fill & Upside Target in Focus 🚀
📊 Current Price Action:
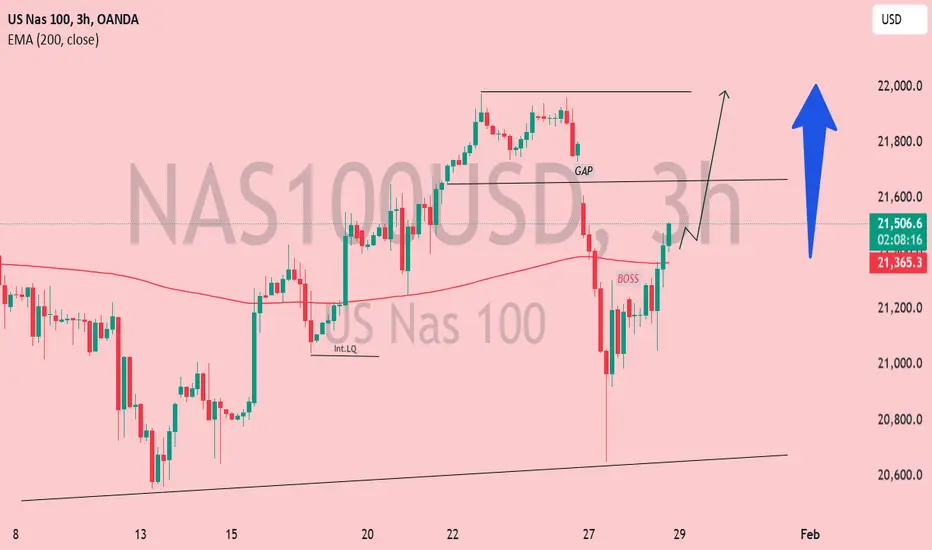
The latest price is 21,490.1 📈, showing a +0.29% gain (+62.3 points) ✅.
The 200 EMA (Exponential Moving Average) 📊 is at 21,365.2, suggesting the price is slightly above this key moving average.
📌 Key Levels & Market Structure:
🔻 BOS (Break of Structure): Indicates a bearish structure break before the current recovery.
📉 GAP: There is a visible gap in the price action, which often acts as a magnet for price movements.
💰 Liquidity & Internal Liquidity (Int. LQ): Suggests areas where institutional interest may have been present.
📈 Trend & Potential Direction:
The price recently bounced off the 200 EMA 🔄, indicating possible bullish momentum 📈.
The ⬆️ arrow projection suggests a bullish outlook, targeting the gap fill and potentially moving higher towards 21,800 - 22,000.
If price holds above 21,365, the bullish thesis remains valid ✅.
🏆 Conclusion:
🐂 Bullish Bias:
Price is recovering from a break of structure (BOS) and pushing higher towards unfilled gaps 📊.
📍 Key Levels to Watch:
🛑 Support: 21,365 (200 EMA) – If it breaks below, downside risk increases ⚠️.
🚧 Resistance: 21,600 (gap area) – Price might struggle before breaking through 🚀.
💡 Trade Idea:
A 📈 long position targeting 21,800+, with a stop loss below 21,365 🔥.
📊 Current Price Action:
The latest price is 21,490.1 📈, showing a +0.29% gain (+62.3 points) ✅.
The 200 EMA (Exponential Moving Average) 📊 is at 21,365.2, suggesting the price is slightly above this key moving average.
📌 Key Levels & Market Structure:
🔻 BOS (Break of Structure): Indicates a bearish structure break before the current recovery.
📉 GAP: There is a visible gap in the price action, which often acts as a magnet for price movements.
💰 Liquidity & Internal Liquidity (Int. LQ): Suggests areas where institutional interest may have been present.
📈 Trend & Potential Direction:
The price recently bounced off the 200 EMA 🔄, indicating possible bullish momentum 📈.
The ⬆️ arrow projection suggests a bullish outlook, targeting the gap fill and potentially moving higher towards 21,800 - 22,000.
If price holds above 21,365, the bullish thesis remains valid ✅.
🏆 Conclusion:
🐂 Bullish Bias:
Price is recovering from a break of structure (BOS) and pushing higher towards unfilled gaps 📊.
📍 Key Levels to Watch:
🛑 Support: 21,365 (200 EMA) – If it breaks below, downside risk increases ⚠️.
🚧 Resistance: 21,600 (gap area) – Price might struggle before breaking through 🚀.
💡 Trade Idea:
A 📈 long position targeting 21,800+, with a stop loss below 21,365 🔥.
Trade active
NAS100 well moved now try to retest in sell again for long bull so be careful an eye on active
Note
well moving now also valid for buy zone Trade closed: target reached
🎯 Nasdaq target hit! Just a few pips left. 💰 Smart traders know—never be greedy, secure those profits! 🚀
JOIN MY TELEGRAM CHANNEL
t.me/StellarMarketAnalysis
JOIN MY RECOMMENTED BROKER REFFREL LINK
⤵️one.exnesstrack.net/a/uvd1etcgg1
PARTNER CODE⤵️
uvd1etcgg1
t.me/StellarMarketAnalysis
JOIN MY RECOMMENTED BROKER REFFREL LINK
⤵️one.exnesstrack.net/a/uvd1etcgg1
PARTNER CODE⤵️
uvd1etcgg1
Disclaimer
The information and publications are not meant to be, and do not constitute, financial, investment, trading, or other types of advice or recommendations supplied or endorsed by TradingView. Read more in the Terms of Use.