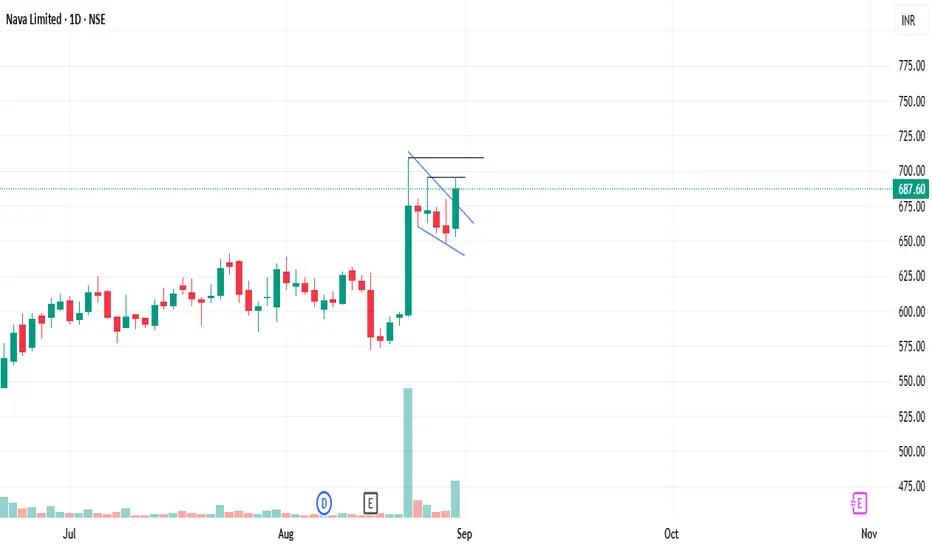
Stock name:- Nava on 1day chart price formed a pole and flag pattern and on 29-aug-2025 price breakout and sustained above and closed which simply means price is ready to move up but there's a immediate resistance at "696" once price breaks it then 710 is our next resistance and there's possibility of 3 scenarios 1.price breaking high and going up till 740-765 level. 2.price breaking high and then take resistance and fall below 700 level & stay in a range then decide the move. 3.price taking resistance at 710 then fall till 660.
for Monday i.e. 1-sep-2025 if price opens gap up wait till 10:15am then on hourly chart see candle then take trade, if flat opens then wait for price to cross 696 level then trade but with less quantity as 700 is psychological round level and 710 a previous high so price can form a big candle & break previous high then fall & retest then go up, so be cautious a little and once price goes up we can add quantity, if gap up price take resistance from 710 and closes below 675 then a fall till 660 can be seen.
for investment/swing trade once price goes above 710 then add up quantity as price can go up till 740-765 in 1st level then to 780 in next tgt level.
Disclaimer:- i'm not a sebi registered analyst and idea shared here is my personal view point which includes various technical indicators and i don't have any investment in this scrip nor do i have any contact with employees of the company the idea shared is for educational purpose so before taking any trade or investment pls consult with your financial advisor.
Note
Disclaimer
The information and publications are not meant to be, and do not constitute, financial, investment, trading, or other types of advice or recommendations supplied or endorsed by TradingView. Read more in the Terms of Use.
Disclaimer
The information and publications are not meant to be, and do not constitute, financial, investment, trading, or other types of advice or recommendations supplied or endorsed by TradingView. Read more in the Terms of Use.