NESTLE INDIA – Ready for Takeoff? 🚀
Stock: Nestle India ( NESTLEIND)
Timeframe: Weekly Chart
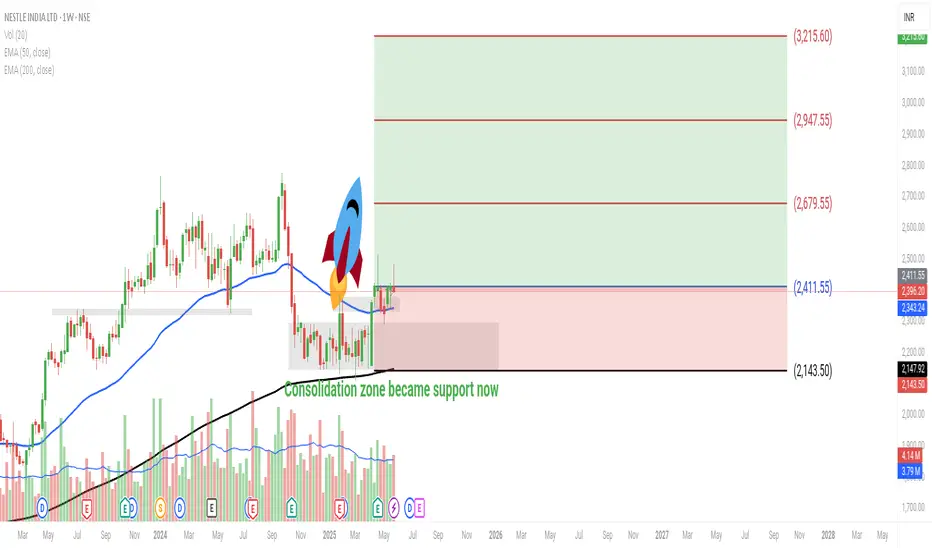
CMP: ₹2,396.20
Breakout Level: ₹2,411.55
Support Zone: ₹2,143 – ₹2,411 ✅
---
Technical View:
✅ After months of consolidation, Nestle India has finally broken out on the weekly chart.
📉 The previous consolidation zone has now flipped into a strong support base.
📊 We also see strong confluence with 50 EMA and 200 EMA — both have provided excellent support.
📈 We may have entered the early stages of a rally toward new all-time highs.
📉 Minor pullback now offering a great opportunity for positional entry.
✈️ Looks like Nestle India is ready to take off after a strong run-up from the runway of the 50 & 200 EMA!
🎯 Structure suggests strength, and the volume profile supports continuation to higher levels.
---
Target Levels:
🔸 1st Target: ₹2,679.55
🔸 2nd Target: ₹2,947.55
🔸 3rd Target: ₹3,215.60
Invalidation/SL:
🔻 Breakdown below ₹2,143 will negate the bullish setup.
---
Note: This is an educational view based on technical analysis. Please do your own research before investing. 📚
Stock: Nestle India (
Timeframe: Weekly Chart
CMP: ₹2,396.20
Breakout Level: ₹2,411.55
Support Zone: ₹2,143 – ₹2,411 ✅
---
Technical View:
✅ After months of consolidation, Nestle India has finally broken out on the weekly chart.
📉 The previous consolidation zone has now flipped into a strong support base.
📊 We also see strong confluence with 50 EMA and 200 EMA — both have provided excellent support.
📈 We may have entered the early stages of a rally toward new all-time highs.
📉 Minor pullback now offering a great opportunity for positional entry.
✈️ Looks like Nestle India is ready to take off after a strong run-up from the runway of the 50 & 200 EMA!
🎯 Structure suggests strength, and the volume profile supports continuation to higher levels.
---
Target Levels:
🔸 1st Target: ₹2,679.55
🔸 2nd Target: ₹2,947.55
🔸 3rd Target: ₹3,215.60
Invalidation/SL:
🔻 Breakdown below ₹2,143 will negate the bullish setup.
---
Note: This is an educational view based on technical analysis. Please do your own research before investing. 📚
Trade active
Disclaimer
The information and publications are not meant to be, and do not constitute, financial, investment, trading, or other types of advice or recommendations supplied or endorsed by TradingView. Read more in the Terms of Use.
Disclaimer
The information and publications are not meant to be, and do not constitute, financial, investment, trading, or other types of advice or recommendations supplied or endorsed by TradingView. Read more in the Terms of Use.