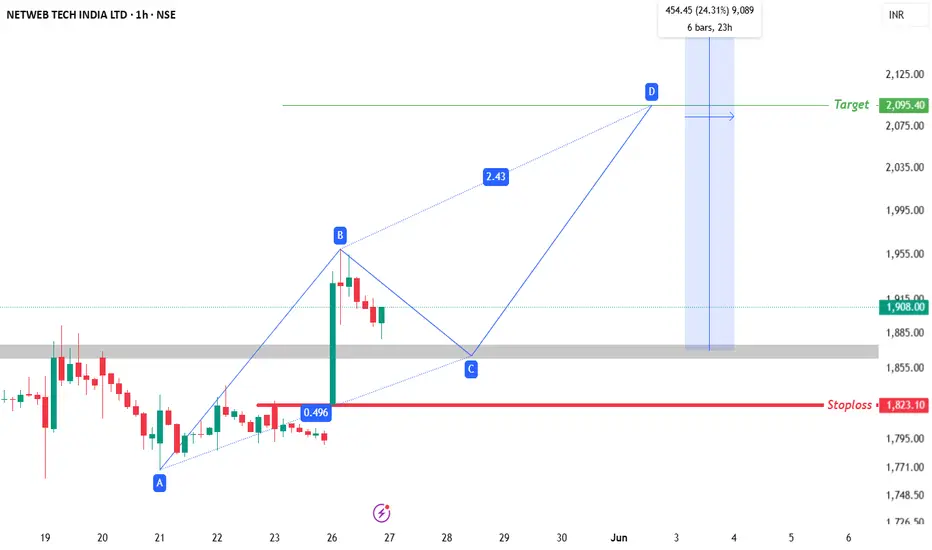
📈 Netweb Tech India LTD Trade Setup (1H Chart)
🔹 Pattern: Bullish Harmonic Formation
🔹 Entry Zone: ₹1865 – ₹1880
🔹 Stoploss: ₹1823.10 (Candle Close Basis)
🔹 Target 1: ₹2095.40 🎯
🔹 Target 2: ₹2310+ 🎯 (Only if ₹2095 breakout happens — approx. 24% upside)
💡 Key Insights:
✅ Bullish Harmonic Setup with ideal Risk:Reward
✅ Entry Zone aligns with key demand area (grey zone)
✅ Target 1: ₹2095.40 is the immediate resistance zone
✅ If ₹2095 is broken, stock has potential to rally up to ₹2310 (24% upside from entry)
✅ Price action near Point C zone is critical for confirmation
📌 Stoploss candle close only, Target Trigger Price
📌 This is not a buy/sell recommendation, just an educational trading idea.
📌 Market conditions can change; always conduct your own research.
📌 Understand risks before investing and take full responsibility for decisions.
Disclaimer
The information and publications are not meant to be, and do not constitute, financial, investment, trading, or other types of advice or recommendations supplied or endorsed by TradingView. Read more in the Terms of Use.
Disclaimer
The information and publications are not meant to be, and do not constitute, financial, investment, trading, or other types of advice or recommendations supplied or endorsed by TradingView. Read more in the Terms of Use.