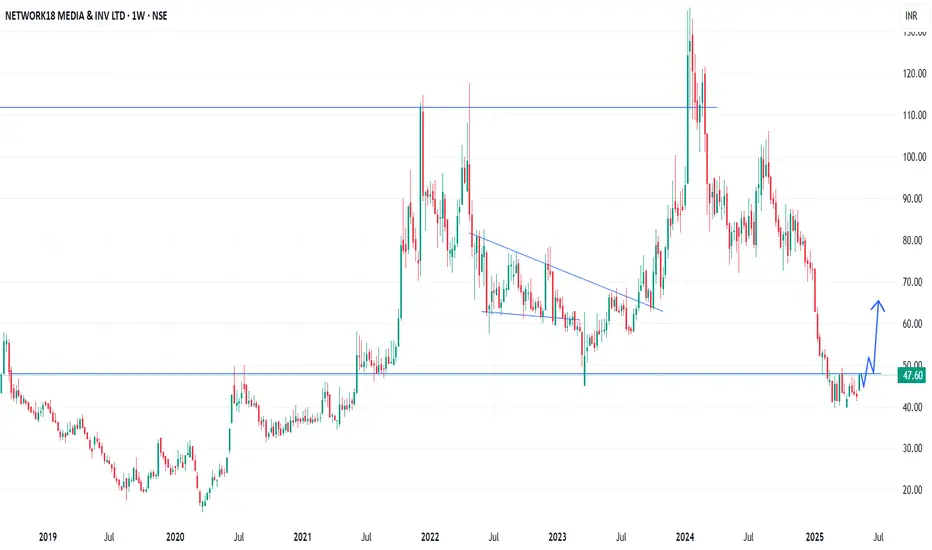
In the Weekly Chart of NETWORK18 ,
we can see that; it is trying to recover from very bottom with W Shape recovery.
Let it create one or two Halt candles to get more strong momentum.
Expected momentum is shown in chart.
we can see that; it is trying to recover from very bottom with W Shape recovery.
Let it create one or two Halt candles to get more strong momentum.
Expected momentum is shown in chart.
Disclaimer
The information and publications are not meant to be, and do not constitute, financial, investment, trading, or other types of advice or recommendations supplied or endorsed by TradingView. Read more in the Terms of Use.
Disclaimer
The information and publications are not meant to be, and do not constitute, financial, investment, trading, or other types of advice or recommendations supplied or endorsed by TradingView. Read more in the Terms of Use.