Is Nifty poised for a deeper correction? And if so, why? Let’s look at it through the lens of Elliott Wave Theory.
Elliott Wave distinguishes between motive waves, which unfold in 5-wave structures, and corrective waves, which unfold in 3-wave patterns. Within a 5-wave move, waves 2 and 4 act as counter-trend corrections. In a 3-wave correction, wave B typically moves against the prevailing trend.
Corrective patterns can take the form of flats, zigzags, or triangles, each with its own character. There are rules for their formation. Interestingly, in bullish market, corrections often behave like a runaway bride in waves 2 and 4 —where they defy clean textbook expectations.
Now, after every 5-wave advance, a correction typically follows. The depth of this correction depends on whether the preceding 5-wave structure was part of a smaller swing or the completion of a larger trend.
So, what’s happening with Nifty?
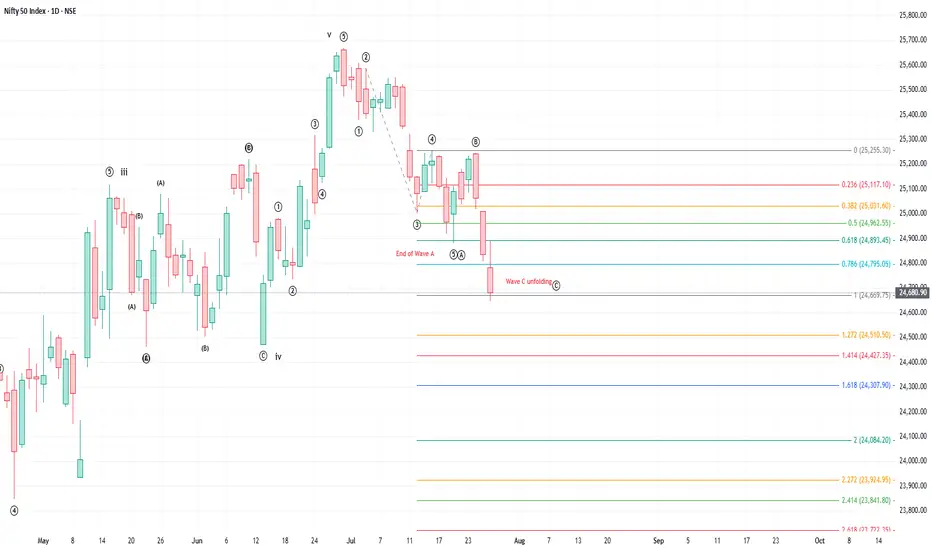
It appears that Nifty has completed a FULL 5-wave advance. The correction from 15 May to 13 June is a flat correction as posted earlier, which followed the end of wave (iii). (I’ll post why it is end of wave (iii) in the comments section.
The next swing up (13 June to 30 June) also unfolded as a clear 5-wave move. If the correction is attributable only to this swing, then it will not go lower than the lower extreme of the swing.
If this upward leg marks end of wave 5 of a larger structure, then what we’re seeing now is a proper 3-wave corrective structure which will bring a decent retracement to the entire up move.
Typically, end points of larger moves can be validated using Fibonacci ratios—like comparing wave 0–3 to 4, or wave 2–3 to 4. In this case, no clear Fibonacci relationship appears, but that sometimes happens.
Now, here's the tricky part: corrective waves are the hardest to decode in Elliott Wave analysis. Markets often react to multiple retracement levels, making early predictions risky unless at least one leg of the correction is fully formed.
Looking at recent action:
The decline from 30 June to 21 July looks like a clean 5-wave down, suggesting a potential wave A. The bounce that followed fits well as a 3-wave move, likely wave B.
And now, Nifty seems to be forming wave C, unfolding rapidly with gap-downs and accelerated moves—a sign that the correction is still in play.
I’ll share more thoughts soon on Wave C as it unfolds in the comments section.
Elliott Wave distinguishes between motive waves, which unfold in 5-wave structures, and corrective waves, which unfold in 3-wave patterns. Within a 5-wave move, waves 2 and 4 act as counter-trend corrections. In a 3-wave correction, wave B typically moves against the prevailing trend.
Corrective patterns can take the form of flats, zigzags, or triangles, each with its own character. There are rules for their formation. Interestingly, in bullish market, corrections often behave like a runaway bride in waves 2 and 4 —where they defy clean textbook expectations.
Now, after every 5-wave advance, a correction typically follows. The depth of this correction depends on whether the preceding 5-wave structure was part of a smaller swing or the completion of a larger trend.
So, what’s happening with Nifty?
It appears that Nifty has completed a FULL 5-wave advance. The correction from 15 May to 13 June is a flat correction as posted earlier, which followed the end of wave (iii). (I’ll post why it is end of wave (iii) in the comments section.
The next swing up (13 June to 30 June) also unfolded as a clear 5-wave move. If the correction is attributable only to this swing, then it will not go lower than the lower extreme of the swing.
If this upward leg marks end of wave 5 of a larger structure, then what we’re seeing now is a proper 3-wave corrective structure which will bring a decent retracement to the entire up move.
Typically, end points of larger moves can be validated using Fibonacci ratios—like comparing wave 0–3 to 4, or wave 2–3 to 4. In this case, no clear Fibonacci relationship appears, but that sometimes happens.
Now, here's the tricky part: corrective waves are the hardest to decode in Elliott Wave analysis. Markets often react to multiple retracement levels, making early predictions risky unless at least one leg of the correction is fully formed.
Looking at recent action:
The decline from 30 June to 21 July looks like a clean 5-wave down, suggesting a potential wave A. The bounce that followed fits well as a 3-wave move, likely wave B.
And now, Nifty seems to be forming wave C, unfolding rapidly with gap-downs and accelerated moves—a sign that the correction is still in play.
I’ll share more thoughts soon on Wave C as it unfolds in the comments section.
ChartTheWave |
t.me/chartthewave
This channel is a common forum for "Elliott Wave Principle" enthusiasts, learners and practitioners. We aim to build a team of traders who practice EWP for common benefit; co-learn, teach, share, validate and benefit.
t.me/chartthewave
This channel is a common forum for "Elliott Wave Principle" enthusiasts, learners and practitioners. We aim to build a team of traders who practice EWP for common benefit; co-learn, teach, share, validate and benefit.
Disclaimer
The information and publications are not meant to be, and do not constitute, financial, investment, trading, or other types of advice or recommendations supplied or endorsed by TradingView. Read more in the Terms of Use.