Top-Down Nifty 50 price structure analysis for 09th December 2025. The day is Tuesday.
(1) Monthly Time Frame:
Red indecisive candle. Major resistance is at level 26100. Minor support is at level 25900. The view is indecisive to bearish.
(2) Weekly Time Frame:
First day of the week. Today's red candle confirms that last week's red paper umbrella was a hanging man. Clear sign of trend reversal. Major resistance is at level 26100. Minor support is at level 25900. The view is bearish.
(3) Daily Time Frame:
It's kind of a red morubozu with a minor 50 points lower wick. The candle engulfed the last 2 days of green candles. A major resistance zone is formed at the levels 26100 - 26000. Minor support is at level 25900. The view is bearish.
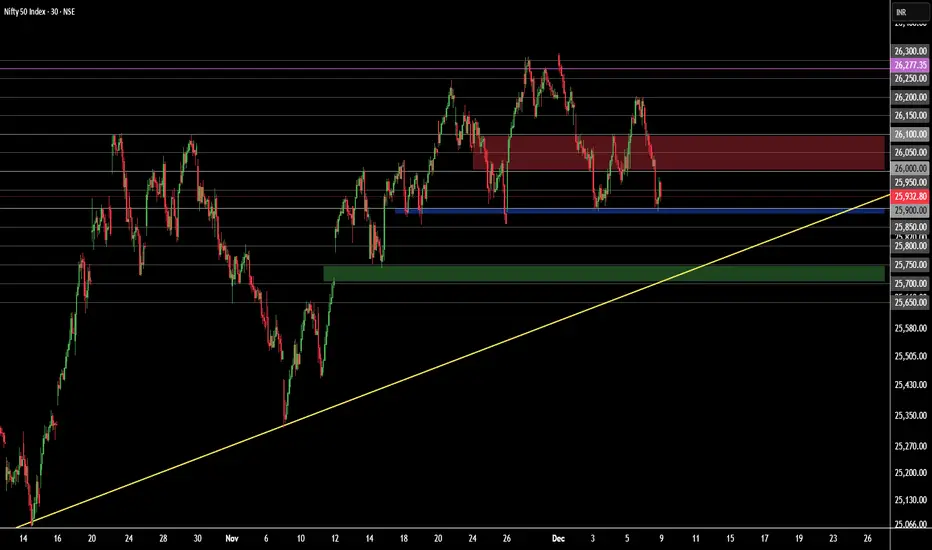
(4) 30-Minute Time Frame:
Two trend reversal patterns are observed. The first pattern is head & shoulder (H&S). The second pattern is a triple top. It's a clear sign of trend reversal. The neck of both the H&S and triple top is formed at the level 25900. A major resistance zone is formed at the zone 26100 - 26000. Minor support is at level 25900. Every up move should be doubted. The view is bearish.
Events:
Nifty 50 weekly expiry. No other high-impact event. However, a major event is on 12 December - the FED interest rate decision. Thus, volatility is expected.
Bullish Scenario Set-Up:
(i) Price sustains above the opening price.
(ii) Price sustains above the level 26100.
Bearish Scenario Set-Up:
(i) Price sustains below the opening price.
(ii) Price sustains below the level 25900 and shows promise of breaking below the level 25850.
(iii) Bearish target is in the zone (25750 - 25700)
Expectations (Hypothesis and Insights from the Trading Plan):
(i) Take a bearish position only. Price must break the level 25900 and show promise of trading below the level 25850.
(ii) Doubt every up move.
(iii) Take no bullish trade until the price starts to trade above the level 26000 - 26100.
(iv) There is a higher probability of breaking down (bearish trend continuation).
(v) After price breaks below the level 25850, there is a higher chance that the price will try to fill the gap in the zone 25750 - 25700.
(vi) Its expiry day. So, expect uncertain price movement in the second half.
(vii) It may happen that bulls might try to expire price above the level 26000 by the end of the day.
(viii) Trade only when bullish/ bearish conditions are fulfilled. Otherwise, don't trade. Protect your resources.
NOTE:
"Mark your points. Trade your points. Price is God. Anything can happen. Therefore, trade what you see, not what you believe."
Happy Trading!
(1) Monthly Time Frame:
Red indecisive candle. Major resistance is at level 26100. Minor support is at level 25900. The view is indecisive to bearish.
(2) Weekly Time Frame:
First day of the week. Today's red candle confirms that last week's red paper umbrella was a hanging man. Clear sign of trend reversal. Major resistance is at level 26100. Minor support is at level 25900. The view is bearish.
(3) Daily Time Frame:
It's kind of a red morubozu with a minor 50 points lower wick. The candle engulfed the last 2 days of green candles. A major resistance zone is formed at the levels 26100 - 26000. Minor support is at level 25900. The view is bearish.
(4) 30-Minute Time Frame:
Two trend reversal patterns are observed. The first pattern is head & shoulder (H&S). The second pattern is a triple top. It's a clear sign of trend reversal. The neck of both the H&S and triple top is formed at the level 25900. A major resistance zone is formed at the zone 26100 - 26000. Minor support is at level 25900. Every up move should be doubted. The view is bearish.
Events:
Nifty 50 weekly expiry. No other high-impact event. However, a major event is on 12 December - the FED interest rate decision. Thus, volatility is expected.
Bullish Scenario Set-Up:
(i) Price sustains above the opening price.
(ii) Price sustains above the level 26100.
Bearish Scenario Set-Up:
(i) Price sustains below the opening price.
(ii) Price sustains below the level 25900 and shows promise of breaking below the level 25850.
(iii) Bearish target is in the zone (25750 - 25700)
Expectations (Hypothesis and Insights from the Trading Plan):
(i) Take a bearish position only. Price must break the level 25900 and show promise of trading below the level 25850.
(ii) Doubt every up move.
(iii) Take no bullish trade until the price starts to trade above the level 26000 - 26100.
(iv) There is a higher probability of breaking down (bearish trend continuation).
(v) After price breaks below the level 25850, there is a higher chance that the price will try to fill the gap in the zone 25750 - 25700.
(vi) Its expiry day. So, expect uncertain price movement in the second half.
(vii) It may happen that bulls might try to expire price above the level 26000 by the end of the day.
(viii) Trade only when bullish/ bearish conditions are fulfilled. Otherwise, don't trade. Protect your resources.
NOTE:
"Mark your points. Trade your points. Price is God. Anything can happen. Therefore, trade what you see, not what you believe."
Happy Trading!
Disclaimer
The information and publications are not meant to be, and do not constitute, financial, investment, trading, or other types of advice or recommendations supplied or endorsed by TradingView. Read more in the Terms of Use.
Disclaimer
The information and publications are not meant to be, and do not constitute, financial, investment, trading, or other types of advice or recommendations supplied or endorsed by TradingView. Read more in the Terms of Use.