Date: 8 Dec 2025 | Timeframe: 15 min | Index near 26,076
Price Action Summary
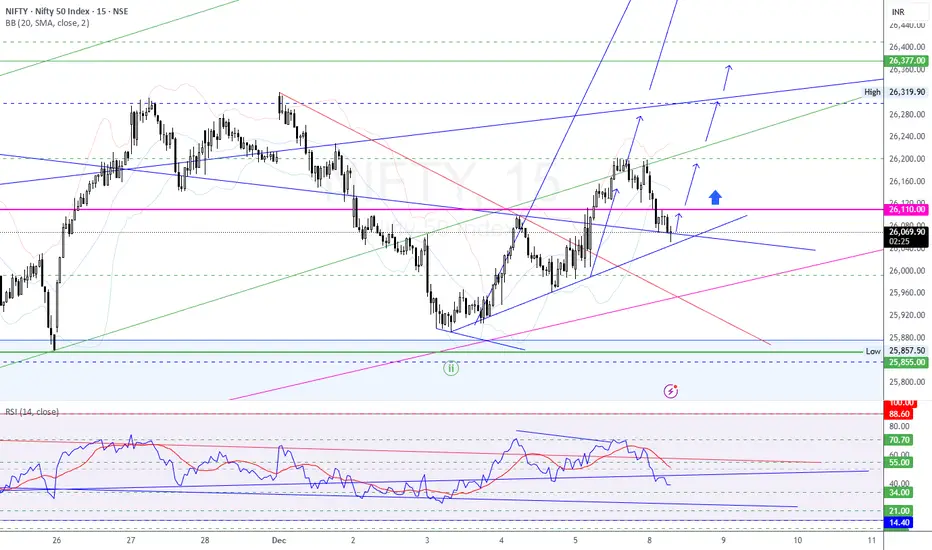
Nifty recently bounced from the lower trendline support created by the rising channel structure.
Price is currently trading above the blue ascending support line, indicating uptrend continuation potential.
26,110–26,120 zone (marked in pink line) is a short-term decision level.
Sustaining above this region can lead to bullish continuation toward upper resistance zones.
🚀 Bullish Scenario
If price sustains above 26,110, then upside levels to watch:
26,160–26,180 (first resistance zone)
26,240–26,260 (trend channel resistance)
26,320–26,380 (major target zone – aligns with upper channel & previous supply zone)
📌 Blue arrows on chart suggest the projected upward moves if breakout holds.
🔻 Bearish / Risk Scenario
Failure to hold above ascending trendline could drag toward:
26,000
25,880–25,855 strong support (demand zone)
If this breaks, deeper correction may follow.
📍 RSI Analysis
RSI formed a bullish divergence earlier and recovered.
Currently sitting near mid-range (40–50 zone), which allows room for upside.
A breakout above 55–60 RSI will confirm bullish momentum.
🎯 Trading Plan (Non-Advice – for analysis only)
Bias Above 26,110 bullish Below 26,000 weak
Intraday opportunity Buy-the-dip setup on trendline support Short only below 26k
Key Levels
Level Role
26,110 Decision zone
26,160 / 26,240 Resistance
26,320 / 26,380 Target zone
26,000 Support
25,880–25,855 Major support
🔮 Conclusion
Nifty is currently in a pullback within an uptrend, respecting structure.
As long as 26,000 support remains intact, probability favors bullish continuation toward 26,240–26,320.
Price Action Summary
Nifty recently bounced from the lower trendline support created by the rising channel structure.
Price is currently trading above the blue ascending support line, indicating uptrend continuation potential.
26,110–26,120 zone (marked in pink line) is a short-term decision level.
Sustaining above this region can lead to bullish continuation toward upper resistance zones.
🚀 Bullish Scenario
If price sustains above 26,110, then upside levels to watch:
26,160–26,180 (first resistance zone)
26,240–26,260 (trend channel resistance)
26,320–26,380 (major target zone – aligns with upper channel & previous supply zone)
📌 Blue arrows on chart suggest the projected upward moves if breakout holds.
🔻 Bearish / Risk Scenario
Failure to hold above ascending trendline could drag toward:
26,000
25,880–25,855 strong support (demand zone)
If this breaks, deeper correction may follow.
📍 RSI Analysis
RSI formed a bullish divergence earlier and recovered.
Currently sitting near mid-range (40–50 zone), which allows room for upside.
A breakout above 55–60 RSI will confirm bullish momentum.
🎯 Trading Plan (Non-Advice – for analysis only)
Bias Above 26,110 bullish Below 26,000 weak
Intraday opportunity Buy-the-dip setup on trendline support Short only below 26k
Key Levels
Level Role
26,110 Decision zone
26,160 / 26,240 Resistance
26,320 / 26,380 Target zone
26,000 Support
25,880–25,855 Major support
🔮 Conclusion
Nifty is currently in a pullback within an uptrend, respecting structure.
As long as 26,000 support remains intact, probability favors bullish continuation toward 26,240–26,320.
Disclaimer
The information and publications are not meant to be, and do not constitute, financial, investment, trading, or other types of advice or recommendations supplied or endorsed by TradingView. Read more in the Terms of Use.
Disclaimer
The information and publications are not meant to be, and do not constitute, financial, investment, trading, or other types of advice or recommendations supplied or endorsed by TradingView. Read more in the Terms of Use.