Nifty 30 min char wave analysis
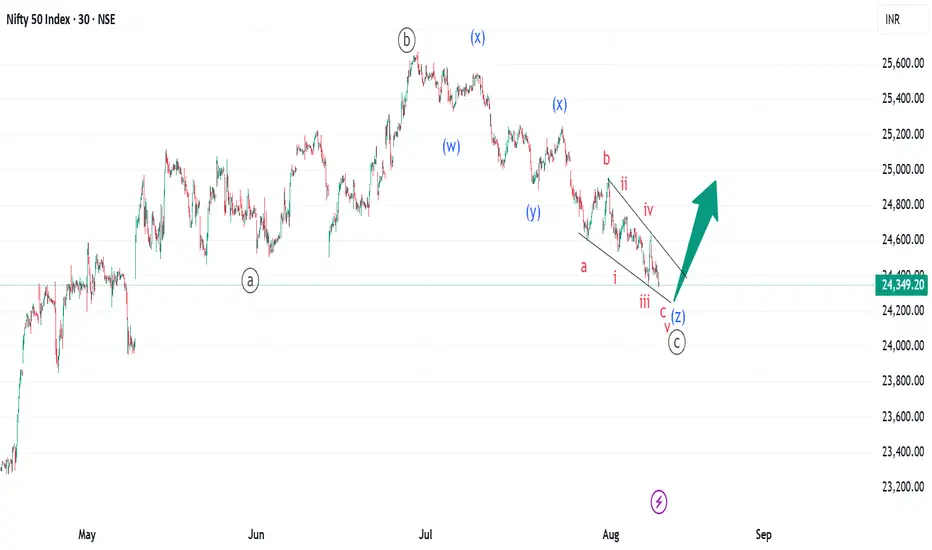
market trade in corrective phase on weekly chart 6 weeks continue in down wave.
I anticipate market should be reversal but sow me some reason or reversal sings
We will understand the market in as simple a way as possible. We should reverse from here but for that we should also see some reversal sings. Does any reversal sings occur on the lower time frame? Some reversal sings indicate its last piece of down wave in lower time frame. Let us study the last piece. It shows four waves and fifth wave missing. Let us try to find the end point of fifth wave. Where can this wave end? Using Fibonacci inversion, we should reverse from 1.27 to 1.618% area 24268- 24168. In this structure, the waves overlap each other, which we know that there is an ending diagonal in which the starting point of the next wave is which can go up to the starting of the ending diagonal.
Thank you
Disclaimer
I am not SEBI registered financial adviser, it is my personal research and posted for only educational purpose. Before taking any trade or investments please take advice from your financial adviser.
MKT Learner
Disclaimer
The information and publications are not meant to be, and do not constitute, financial, investment, trading, or other types of advice or recommendations supplied or endorsed by TradingView. Read more in the Terms of Use.
Disclaimer
The information and publications are not meant to be, and do not constitute, financial, investment, trading, or other types of advice or recommendations supplied or endorsed by TradingView. Read more in the Terms of Use.