Closing Price (Sept 1): 24,527.55 (▲ +0.42%)
Current Session (Intraday – Sept 2): Around 24,425–24,430
Technical Levels:
Immediate Support: 24,350
Next Support: 24,250
Immediate Resistance: 24,600
Next Resistance: 24,750
🔹 Advanced Levels
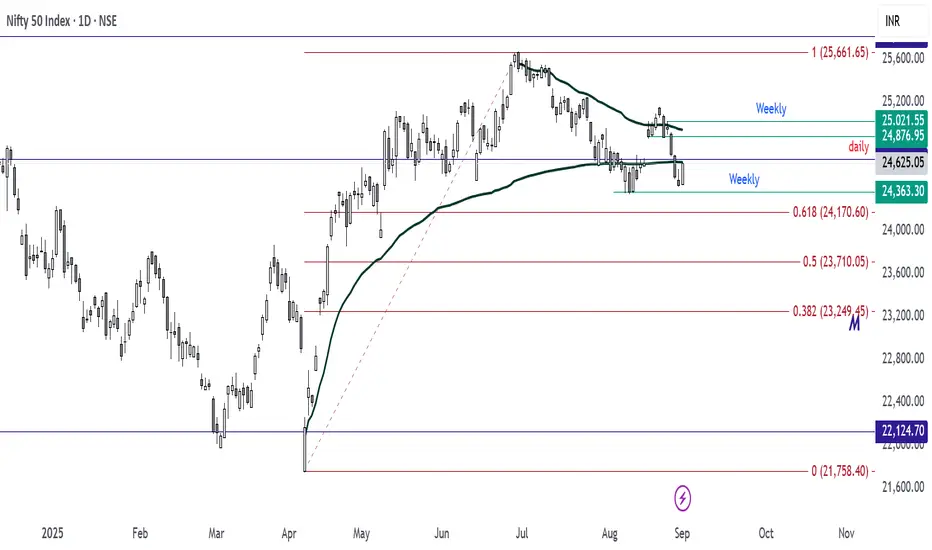
Anchored Volume Profile Resistance: 24,626 and 24,930
Fibonacci Daily Resistance (0.618): 25,170
Daily Time Frame Zone: 24,624 – 24,876
🔹 Indicators
RSI (14): Neutral zone (~52)
20-Day SMA: Flat, showing consolidation
50-Day SMA: Uptrend intact, but momentum fading
Candle Setup (Sept 1): Small-bodied with upper wick → selling pressure near highs
🔹 Price Action Notes
On Monday (Sept 1), Nifty broke above Friday’s high which is crucial
If sustained, upside momentum possible toward resistance zones
Seasonal sentiment (festival & marriage season) may provide additional support
🔹 Trade Setup (1H Time Frame)
Bullish Scenario:
If price sustains above 24,664 → go long,
Stop Loss (SL): 1H candle low (confirmed using 15-min chart)
Target: 24,876
Bearish Scenario:
If a Pin Bar forms near 24,624 on 1H → go short
Stop Loss (SL): Pin Bar candle high (confirmed on 15-min chart)
Target 1: 24,550 Target 2: Trail using 15-min candles down to 24,500 → 24,400
🔹 Chart View
Range: 24,350 – 24,600 (critical breakout zone)
Upside expansion possible if 24,626/24,664 holds
Downside risk if rejection occurs at 24,624 zone
🔖 Disclaimer: This is a technical chart-based study for educational purposes only. Not financial advice.
Current Session (Intraday – Sept 2): Around 24,425–24,430
Technical Levels:
Immediate Support: 24,350
Next Support: 24,250
Immediate Resistance: 24,600
Next Resistance: 24,750
🔹 Advanced Levels
Anchored Volume Profile Resistance: 24,626 and 24,930
Fibonacci Daily Resistance (0.618): 25,170
Daily Time Frame Zone: 24,624 – 24,876
🔹 Indicators
RSI (14): Neutral zone (~52)
20-Day SMA: Flat, showing consolidation
50-Day SMA: Uptrend intact, but momentum fading
Candle Setup (Sept 1): Small-bodied with upper wick → selling pressure near highs
🔹 Price Action Notes
On Monday (Sept 1), Nifty broke above Friday’s high which is crucial
If sustained, upside momentum possible toward resistance zones
Seasonal sentiment (festival & marriage season) may provide additional support
🔹 Trade Setup (1H Time Frame)
Bullish Scenario:
If price sustains above 24,664 → go long,
Stop Loss (SL): 1H candle low (confirmed using 15-min chart)
Target: 24,876
Bearish Scenario:
If a Pin Bar forms near 24,624 on 1H → go short
Stop Loss (SL): Pin Bar candle high (confirmed on 15-min chart)
Target 1: 24,550 Target 2: Trail using 15-min candles down to 24,500 → 24,400
🔹 Chart View
Range: 24,350 – 24,600 (critical breakout zone)
Upside expansion possible if 24,626/24,664 holds
Downside risk if rejection occurs at 24,624 zone
🔖 Disclaimer: This is a technical chart-based study for educational purposes only. Not financial advice.
Disclaimer
The information and publications are not meant to be, and do not constitute, financial, investment, trading, or other types of advice or recommendations supplied or endorsed by TradingView. Read more in the Terms of Use.
Disclaimer
The information and publications are not meant to be, and do not constitute, financial, investment, trading, or other types of advice or recommendations supplied or endorsed by TradingView. Read more in the Terms of Use.