The past week saw a reactive move and the Index could not hold above 19800 though it attempted twice. Every attempt to spike higher is being punished with selling. The Index made a bearish candle. However, it had not breached the previous week’s low. It remains to be seen if this fall is account of profit booking or a reversal.
A few observations from the weekly charts are:
Expected scenarios for the ensuing week
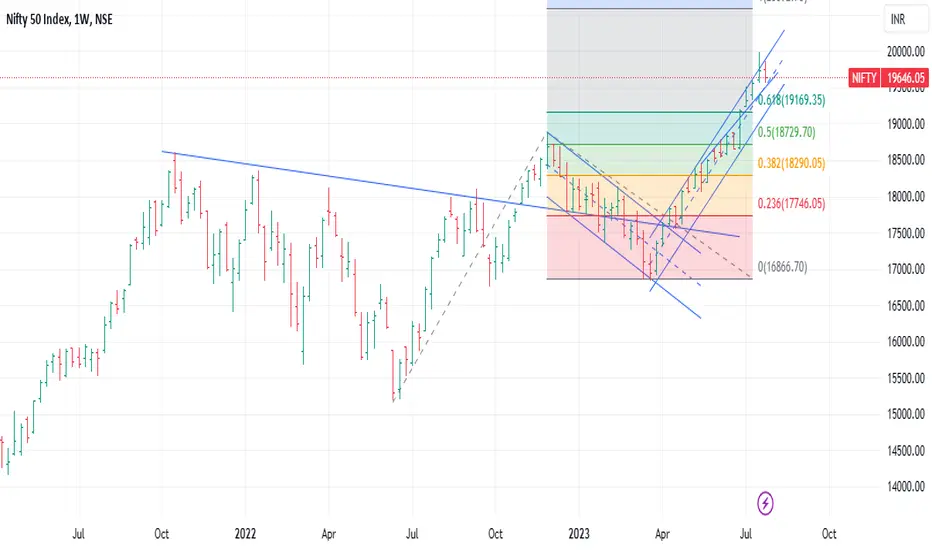
The Index has taken sufficient time to consolidate between 19500 &19700 before breaking out
Index has come back to the original channel
Index may find supports at 19570, 19440,19320 and the index could face resistances at multiple levels19860,19970 and 20030
Additional interesting observations
Final Note
Disclaimer: The views expressed here are personal and not connected to SYFX Treasury Foundation. The views are for learning and reference purpose only.
A few observations from the weekly charts are:
- The index moved in a range of 304 points viz. between 19867 and 19563
- The oscillators of different time frames are showing mixed signals
- Just one session left for the monthly closing candle and the Option open interest to drive the direction of the market
Expected scenarios for the ensuing week
The Index has taken sufficient time to consolidate between 19500 &19700 before breaking out
Index has come back to the original channel
Index may find supports at 19570, 19440,19320 and the index could face resistances at multiple levels19860,19970 and 20030
Additional interesting observations
- The Index is still seen in positive territory and may remain positive till we see a weekly close below 19300
- There has been a few Gaps created in this bull run
- 18818-18908 (28th Jun 23) far off for now
- 18972-19079 (29th July 23) far off for now
- 19189-19246 (3rd July 23) far off for now
Final Note
- The Index has stayed well above the long-term trend line and the 200 DMA at 18167 and 55 DMA at 18943
- Index is moving in an ascending channel having a depth of about 700 points. The top of the channel at 19990 the lower end at 19277 and median at 19620
- Currently the Index is around the mid-point of the channel
- Post Covid 19 crash in Mar 20, we have seen positive candles in the month of July. The story
so far has been showing similar trends continuing. With Just one session left for the monthly closing candle, we can hope that there may not be a negative candle. - The Index has achieved a fresh milestone and the formation in daily charts appear that of a flag and a W formation in the weekly, the target could be another 600-700 points.
- Index still has an unfinished agenda of scaling 20200 and then 20500. When and How is the question
- A consolidation would prove the strength of the move
- A daily close below 19520 would see the Index drift towards 19230
- Need to remain vigilant as drag can be on both sides
- Expected to consolidate remain in the range of 19520-19920 and any close outside the range requires re-assessment of risk
- Apparently there appears two distinct fault lines-the lower one at 19520 an the top one at 19920. There are chances of 200 points move if either of this is breached on a daily closing basis.
- Daily close above 19770 required for further gains.
Disclaimer: The views expressed here are personal and not connected to SYFX Treasury Foundation. The views are for learning and reference purpose only.
Disclaimer
The information and publications are not meant to be, and do not constitute, financial, investment, trading, or other types of advice or recommendations supplied or endorsed by TradingView. Read more in the Terms of Use.
Disclaimer
The information and publications are not meant to be, and do not constitute, financial, investment, trading, or other types of advice or recommendations supplied or endorsed by TradingView. Read more in the Terms of Use.