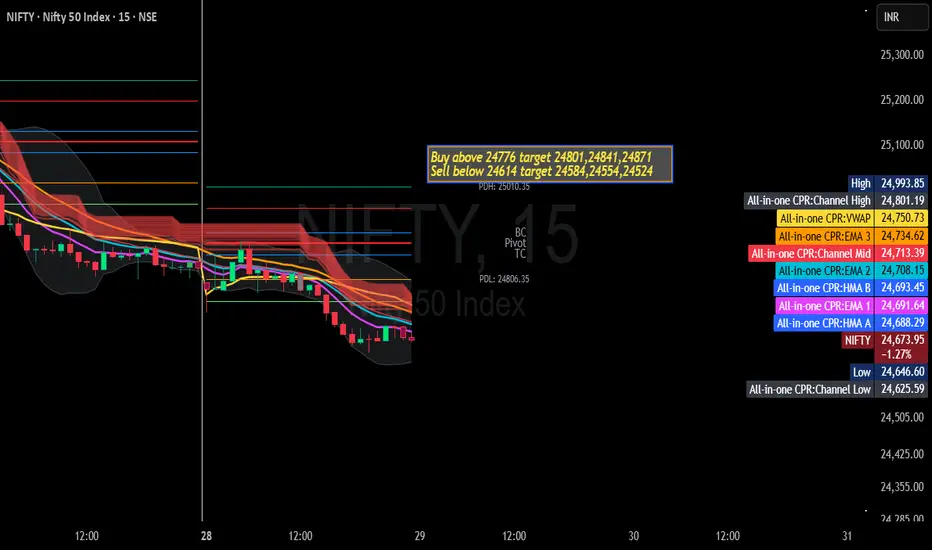
📢 NIFTY Intraday Trading Plan 📢
💼 Instrument: NIFTY Index
🧠 For Beginners & Experienced Traders
🕒 Recommended Chart Timeframe: 15-Minute Candles
✅ Bullish Plan – Buy Setup
🟢 Buy Above: ₹ 24,776
📌 Entry Rule for Novice Traders:
Wait for a 15-minute candle to close above ₹24,776.
🔼 Once it closes, enter above the high of that specific candle.
This helps avoid false breakouts and confirms trend strength.
🎯 Targets:
🔹 Target 1: ₹24,801
🔹 Target 2: ₹24,841
🔹 Target 3: ₹24,871
🔐 Suggested Stop-Loss:
Below the low of the breakout candle or around ₹24,740 (based on structure/support).
🛠️ Tools You Can Use:
✔️ Trendline Break
✔️ Volume Spike Confirmation
✔️ RSI above 50 to support bullish move
🔻 Bearish Plan – Sell Setup
🔴 Sell Below: ₹ 24,614
📌 Entry Rule for Novice Traders:
Wait for a 15-minute candle to close below ₹24,614.
🔽 Once it closes, enter below the low of that specific candle.
This ensures you're entering only after proper confirmation.
🎯 Targets:
🔸 Target 1: ₹24,584
🔸 Target 2: ₹24,554
🔸 Target 3: ₹24,524
🔐 Suggested Stop-Loss:
Above the high of the breakdown candle or around ₹24,645 (based on resistance level).
🛠️ Tools You Can Use:
✔️ Price-Action Zones
✔️ EMA crossover confirmation
✔️ RSI below 50 to support bearish move
📚 Beginner Tips:
🔰 Trade only if you understand the setup.
🔰 Don’t rush — wait for the 15-minute candle to close before entering.
🔰 Always use a stop-loss to protect your capital.
🔰 Risk only 1-2% of your capital on a single trade.
⚠️ Disclaimer:
🚫 I am not a SEBI-registered advisor.
📘 This trade idea is shared for educational and informational purposes only.
💼 Please do your own research or consult a professional financial advisor before taking any trade.
📉 Trading involves high risk. Past performance is not indicative of future results.
🙏 I am not responsible for any profit or loss incurred.
Disclaimer
The information and publications are not meant to be, and do not constitute, financial, investment, trading, or other types of advice or recommendations supplied or endorsed by TradingView. Read more in the Terms of Use.
Disclaimer
The information and publications are not meant to be, and do not constitute, financial, investment, trading, or other types of advice or recommendations supplied or endorsed by TradingView. Read more in the Terms of Use.
