🏦 NIFTY 50 INDEX – Double Top Pattern Formation with Gap Below | 15-Min Chart
📅 Date: April 28, 2025
📈 Timeframe: 15-Minute
🔍 Index: Nifty 50 (NSE)
📌 Technical Overview:
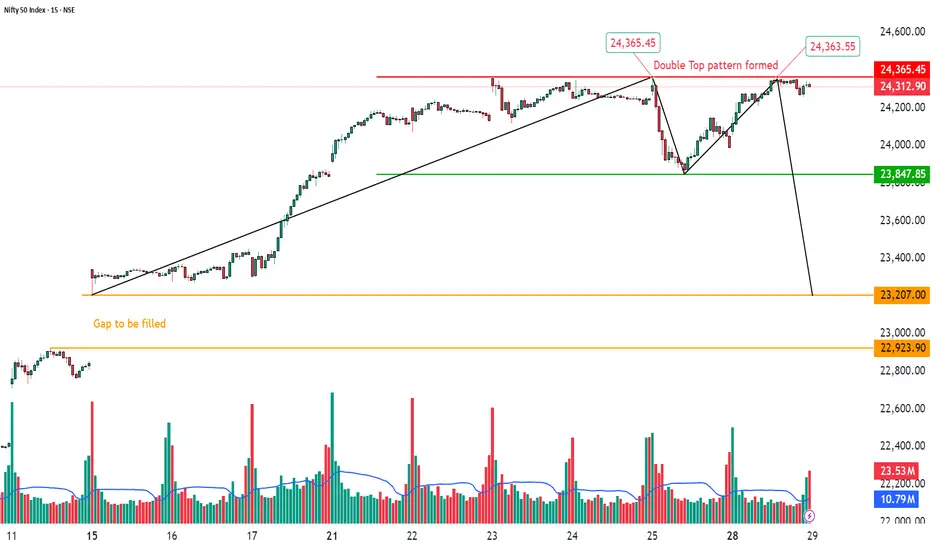
Nifty 50 has formed a Double Top pattern on the 15-minute chart around the 24,365 zone, a classic bearish reversal structure.
The price faced rejection at the previous high, signaling caution. Immediate support lies at 23,847, and a breakdown below this level could open downside momentum toward the gap area visible on the chart.
🧩 Chart Pattern:
Double Top identified at 24,365 levels (marked in red).
Neckline support positioned at 23,847 (green line).
A black trendline breakdown already visible, strengthening bearish bias.
Below 23,847, focus shifts to the gap fill zone between 23,207 and 22,923 (orange highlighted).
🔍 Key Price Levels:
Resistance: 24,365
Immediate Support: 23,847
Gap Zone Support: 23,207–22,923
CMP: 24,312.90
A clear breakdown below 23,847 could accelerate the fall toward the gap area.
📊 Volume Analysis:
Increasing selling volume observed near the second top.
The breakout attempt was met with significant volume resistance, hinting at supply dominance.
🧠 Observational Bias:
As long as Nifty stays below 24,365 and breaches 23,847 decisively, bears may remain in control. Traders should watch for either a gap fill attempt or a possible bounce if price retests 23,847 from below.
📅 Date: April 28, 2025
📈 Timeframe: 15-Minute
🔍 Index: Nifty 50 (NSE)
📌 Technical Overview:
Nifty 50 has formed a Double Top pattern on the 15-minute chart around the 24,365 zone, a classic bearish reversal structure.
The price faced rejection at the previous high, signaling caution. Immediate support lies at 23,847, and a breakdown below this level could open downside momentum toward the gap area visible on the chart.
🧩 Chart Pattern:
Double Top identified at 24,365 levels (marked in red).
Neckline support positioned at 23,847 (green line).
A black trendline breakdown already visible, strengthening bearish bias.
Below 23,847, focus shifts to the gap fill zone between 23,207 and 22,923 (orange highlighted).
🔍 Key Price Levels:
Resistance: 24,365
Immediate Support: 23,847
Gap Zone Support: 23,207–22,923
CMP: 24,312.90
A clear breakdown below 23,847 could accelerate the fall toward the gap area.
📊 Volume Analysis:
Increasing selling volume observed near the second top.
The breakout attempt was met with significant volume resistance, hinting at supply dominance.
🧠 Observational Bias:
As long as Nifty stays below 24,365 and breaches 23,847 decisively, bears may remain in control. Traders should watch for either a gap fill attempt or a possible bounce if price retests 23,847 from below.
Trade closed manually
STWP | Mentor & Demand-Supply Specialist | Empowering traders through structured learning |
simpletradewithpatience.com
Community: chat.whatsapp.com/BEYz0tkqP0fJPBCWf59uel
wa.me/message/6IOPHGOXMGZ4N1
Educational Only
simpletradewithpatience.com
Community: chat.whatsapp.com/BEYz0tkqP0fJPBCWf59uel
wa.me/message/6IOPHGOXMGZ4N1
Educational Only
Disclaimer
The information and publications are not meant to be, and do not constitute, financial, investment, trading, or other types of advice or recommendations supplied or endorsed by TradingView. Read more in the Terms of Use.