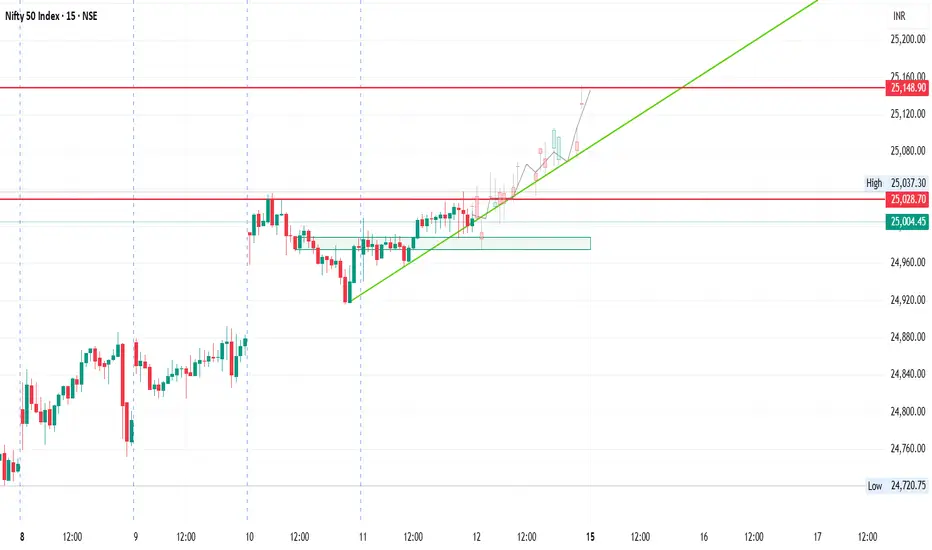
Ascending Trendline (Green): Nifty is respecting the rising trendline, confirming higher lows on the 15-minute chart. As long as this holds, the short-term bias remains bullish.
Support Zone (Green Box): Strong intraday demand has formed near 24980–25000, acting as the immediate floor.
Resistance Zone (Red Line): Overhead hurdle sits at 25030, followed by the next target at 25150.
Bearish Case (Trendline Break Risk)
If Nifty fails to hold the rising trendline and slips below 24980, selling pressure may increase.
Downside targets: 24920 → 24880.
Disclaimer
The information and publications are not meant to be, and do not constitute, financial, investment, trading, or other types of advice or recommendations supplied or endorsed by TradingView. Read more in the Terms of Use.
Disclaimer
The information and publications are not meant to be, and do not constitute, financial, investment, trading, or other types of advice or recommendations supplied or endorsed by TradingView. Read more in the Terms of Use.