📊 Nifty Intraday Trading Plan – 15-Minute Timeframe
Instrument: Nifty 50 Index (Spot or Futures)
Analysis Basis: 15-minute candlestick chart
Method: Breakout strategy based on candle close above/below key price levels
🟢 Buy Setup – Bullish Breakout
✅ Entry Conditions:
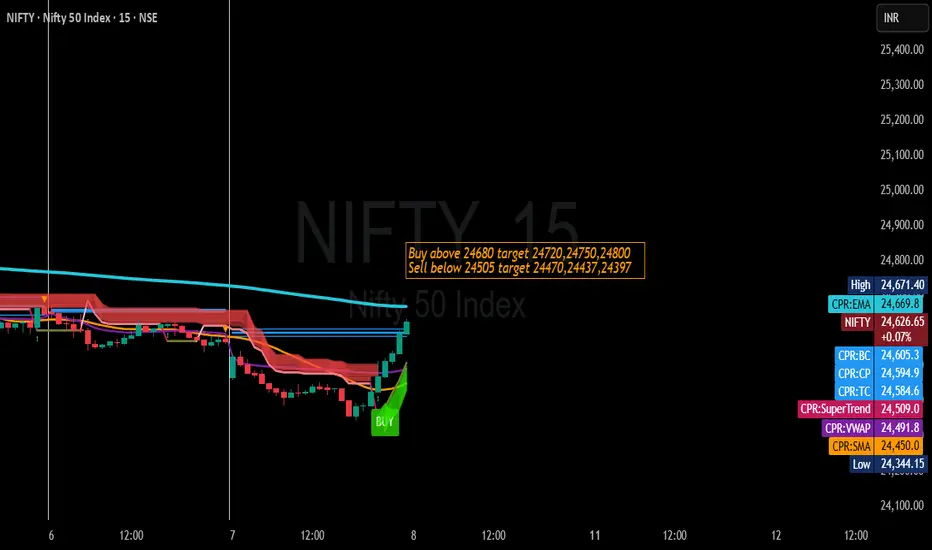
Wait for a full 15-minute candle to close above 24,680.
Ensure the candle body is clearly above the level, not just a wick.
Place your buy order above the high of that confirmed breakout candle to avoid false breakouts.
💵 Entry Price: Above breakout candle high if it closes above 24,680
🎯 Profit Targets:
Target 1: 24,720 (Immediate short-term resistance)
Target 2: 24,750 (Intermediate resistance zone)
Target 3: 24,800 (Major resistance for the session)
🛑 Stop Loss:
Conservative: Just below 24,680 breakout level.
Aggressive: Below the breakout candle’s low.
📌 Trade Management:
Once Target 1 is hit, move stop loss to breakeven.
Book partial profits at each target and let the rest ride with a trailing stop.
🔴 Sell Setup – Bearish Breakdown
✅ Entry Conditions:
Wait for a full 15-minute candle to close below 24,505.
Ensure the candle body is clearly below the level, showing strong selling pressure.
Place your sell order below the low of that breakdown candle for confirmation.
💵 Entry Price: Below breakdown candle low if it closes below 24,505
🎯 Profit Targets:
Target 1: 24,470 (Immediate short-term support)
Target 2: 24,437 (Intermediate support zone)
Target 3: 24,397 (Major support for the session)
🛑 Stop Loss:
Conservative: Just above 24,505 breakdown level.
Aggressive: Above the breakdown candle’s high.
📌 Trade Management:
Once Target 1 is achieved, move stop loss to breakeven.
Scale out profits at each target to reduce risk.
📌 Risk Management Notes
Risk only 1–2% of your total capital per trade.
Avoid trading during high-volatility news events unless planned.
Monitor slippage and spreads, especially near market open or news times.
Stick to your stop loss and avoid averaging into losing trades.
📌 Example Trade Scenarios
Bullish Example:
15-min candle closes at 24,683 with a high of 24,686 and a low of 24,672.
Buy stop at 24,687, stop loss at 24,671, first target 24,720.
Bearish Example:
15-min candle closes at 24,502 with a high of 24,508 and a low of 24,498.
Sell stop at 24,497, stop loss at 24,509, first target 24,470.
⚠️ Disclaimer
I am not SEBI registered. This content is for educational purposes only and should not be considered financial advice or a recommendation to trade. Trading in the stock market involves substantial risk and may result in losses greater than your initial investment. Always do your own analysis and, if necessary, consult a SEBI-registered investment advisor before making trading decisions.
Instrument: Nifty 50 Index (Spot or Futures)
Analysis Basis: 15-minute candlestick chart
Method: Breakout strategy based on candle close above/below key price levels
🟢 Buy Setup – Bullish Breakout
✅ Entry Conditions:
Wait for a full 15-minute candle to close above 24,680.
Ensure the candle body is clearly above the level, not just a wick.
Place your buy order above the high of that confirmed breakout candle to avoid false breakouts.
💵 Entry Price: Above breakout candle high if it closes above 24,680
🎯 Profit Targets:
Target 1: 24,720 (Immediate short-term resistance)
Target 2: 24,750 (Intermediate resistance zone)
Target 3: 24,800 (Major resistance for the session)
🛑 Stop Loss:
Conservative: Just below 24,680 breakout level.
Aggressive: Below the breakout candle’s low.
📌 Trade Management:
Once Target 1 is hit, move stop loss to breakeven.
Book partial profits at each target and let the rest ride with a trailing stop.
🔴 Sell Setup – Bearish Breakdown
✅ Entry Conditions:
Wait for a full 15-minute candle to close below 24,505.
Ensure the candle body is clearly below the level, showing strong selling pressure.
Place your sell order below the low of that breakdown candle for confirmation.
💵 Entry Price: Below breakdown candle low if it closes below 24,505
🎯 Profit Targets:
Target 1: 24,470 (Immediate short-term support)
Target 2: 24,437 (Intermediate support zone)
Target 3: 24,397 (Major support for the session)
🛑 Stop Loss:
Conservative: Just above 24,505 breakdown level.
Aggressive: Above the breakdown candle’s high.
📌 Trade Management:
Once Target 1 is achieved, move stop loss to breakeven.
Scale out profits at each target to reduce risk.
📌 Risk Management Notes
Risk only 1–2% of your total capital per trade.
Avoid trading during high-volatility news events unless planned.
Monitor slippage and spreads, especially near market open or news times.
Stick to your stop loss and avoid averaging into losing trades.
📌 Example Trade Scenarios
Bullish Example:
15-min candle closes at 24,683 with a high of 24,686 and a low of 24,672.
Buy stop at 24,687, stop loss at 24,671, first target 24,720.
Bearish Example:
15-min candle closes at 24,502 with a high of 24,508 and a low of 24,498.
Sell stop at 24,497, stop loss at 24,509, first target 24,470.
⚠️ Disclaimer
I am not SEBI registered. This content is for educational purposes only and should not be considered financial advice or a recommendation to trade. Trading in the stock market involves substantial risk and may result in losses greater than your initial investment. Always do your own analysis and, if necessary, consult a SEBI-registered investment advisor before making trading decisions.
Disclaimer
The information and publications are not meant to be, and do not constitute, financial, investment, trading, or other types of advice or recommendations supplied or endorsed by TradingView. Read more in the Terms of Use.
Disclaimer
The information and publications are not meant to be, and do not constitute, financial, investment, trading, or other types of advice or recommendations supplied or endorsed by TradingView. Read more in the Terms of Use.