> Previous Month (November) price has formed a Positive Base Candle.
* High- 26310 * Low - 25318 * Open - 25696 * Close - 26202
> On November 2 week price has given a Bullish Upside move after that continuesly 4 Week price has formed Base Candle No Upside or Downside Big Movementum.
> Current price of the market is 25693
> Previous week Low was 25693
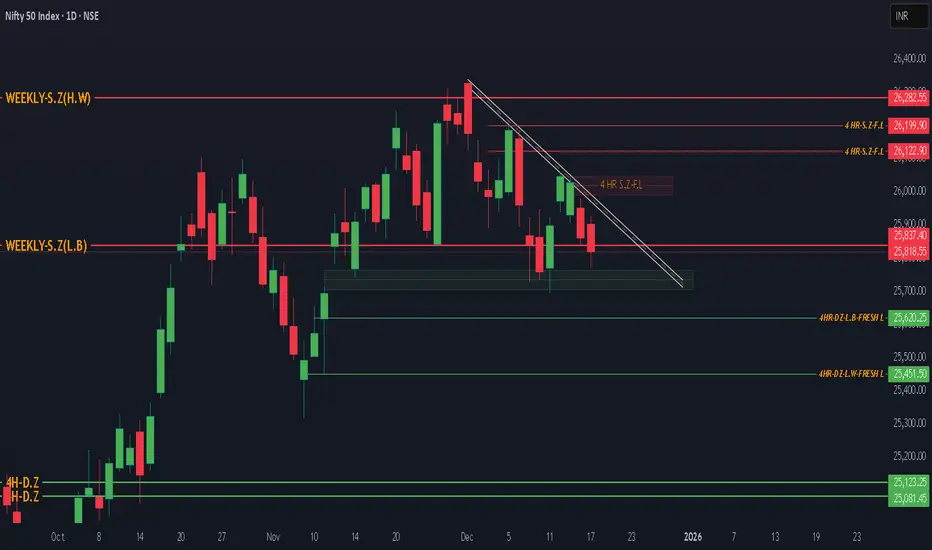
Support Level in Higher Time Frame ( Minor Support Level)
1 . 25696 this level is the support of Monthly Time frame which nis the Open Price of the Previous Month Candle.
2 . 25500 this is the weekly support level.
Major Support Level
1 . 24734 to 24337 is the Major Support Level in Monthly Time Frame.
Reason-: This has 1 Drop candle 2 Base candle and A very Big Rally Candle which is the bullish pattern .
Now price has taken two times support from 25696. Now this level is week and upside two good supply zones are there in 4 hour time frame.
And Downside 25620 to 25451 is the next demand zone in 4 hour time frame which can give support to the price.
RSI Indigator is also showing downside diversion from 29th October 2025.
* High- 26310 * Low - 25318 * Open - 25696 * Close - 26202
> On November 2 week price has given a Bullish Upside move after that continuesly 4 Week price has formed Base Candle No Upside or Downside Big Movementum.
> Current price of the market is 25693
> Previous week Low was 25693
Support Level in Higher Time Frame ( Minor Support Level)
1 . 25696 this level is the support of Monthly Time frame which nis the Open Price of the Previous Month Candle.
2 . 25500 this is the weekly support level.
Major Support Level
1 . 24734 to 24337 is the Major Support Level in Monthly Time Frame.
Reason-: This has 1 Drop candle 2 Base candle and A very Big Rally Candle which is the bullish pattern .
Now price has taken two times support from 25696. Now this level is week and upside two good supply zones are there in 4 hour time frame.
And Downside 25620 to 25451 is the next demand zone in 4 hour time frame which can give support to the price.
RSI Indigator is also showing downside diversion from 29th October 2025.
Disclaimer
The information and publications are not meant to be, and do not constitute, financial, investment, trading, or other types of advice or recommendations supplied or endorsed by TradingView. Read more in the Terms of Use.
Disclaimer
The information and publications are not meant to be, and do not constitute, financial, investment, trading, or other types of advice or recommendations supplied or endorsed by TradingView. Read more in the Terms of Use.