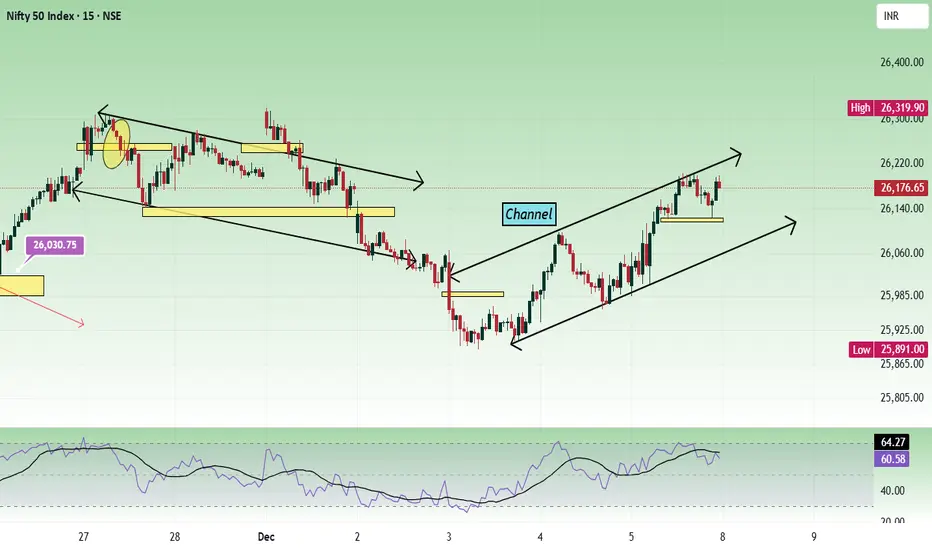
We can see two types of channels in the chart. Channel resistance and double top resistance is at the 26200 - 26220 zone. 26320 is another resistance. Since we can see 2 resistances nearby, and if the price is unable to gain strength, this zone can be choppy. As long as the price is above 26000, it is buy on dips unless the price falls with strong bearish strength.
Friday's movement was bullish as per the daily chart.

Buy above 26100 with the stop loss of 26050 for the targets 26140, 26180, 26240, 26300, 26360, 26420 and 26480.
Sell below 25900 with the stop loss of 25960 for the targets 25860, 25820, 25760, 25700, 25660, and 25600.
Always do your analysis before taking any trade.
Friday's movement was bullish as per the daily chart.
Buy above 26100 with the stop loss of 26050 for the targets 26140, 26180, 26240, 26300, 26360, 26420 and 26480.
Sell below 25900 with the stop loss of 25960 for the targets 25860, 25820, 25760, 25700, 25660, and 25600.
Always do your analysis before taking any trade.
Note
Channel's lower trend line is getting tested. Role I play here : Moderator. Follow me in telegram to trade better. t.me/Analysis4Newbie Contact information : tradingplan4u@gmail.com
Disclaimer
The information and publications are not meant to be, and do not constitute, financial, investment, trading, or other types of advice or recommendations supplied or endorsed by TradingView. Read more in the Terms of Use.
Role I play here : Moderator. Follow me in telegram to trade better. t.me/Analysis4Newbie Contact information : tradingplan4u@gmail.com
Disclaimer
The information and publications are not meant to be, and do not constitute, financial, investment, trading, or other types of advice or recommendations supplied or endorsed by TradingView. Read more in the Terms of Use.