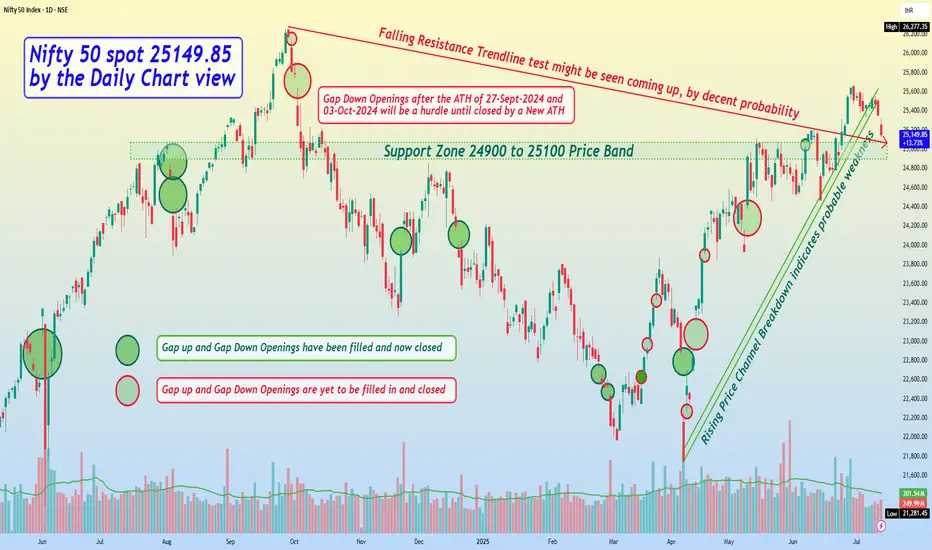
Nifty 50 spot 25149.85 by the Daily Chart view - Weekly update
- Support Zone 24900 to 25100 Price Band, yet sustained
- Next Support Zone seen at 24325 to 24500 of the Nifty Index
- Resistance Zone 25860 to 26035 then ATH 26277.35 of Nifty Index levels
- Rising Price Channel Breakdown indicates probable weakness to see following
- Falling Resistance Trendline test might be seen coming up, by decent probability
- Nifty Index keeping within self drawn limits and shying away at each attempt towards 26000
Related publications
Disclaimer
The information and publications are not meant to be, and do not constitute, financial, investment, trading, or other types of advice or recommendations supplied or endorsed by TradingView. Read more in the Terms of Use.
Related publications
Disclaimer
The information and publications are not meant to be, and do not constitute, financial, investment, trading, or other types of advice or recommendations supplied or endorsed by TradingView. Read more in the Terms of Use.