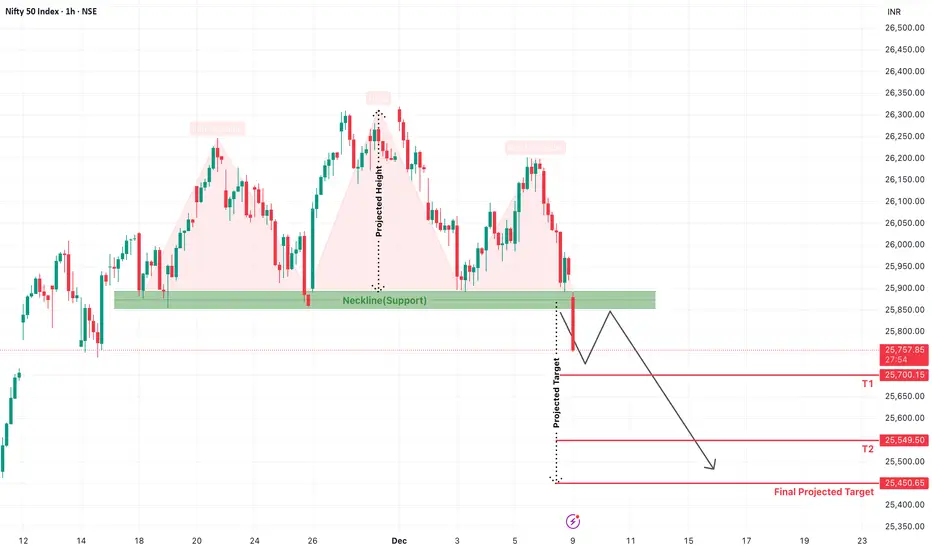
The Nifty 50 index has officially broken below a crucial support zone, completing a classic Head & Shoulders reversal pattern on the 1-hour chart. This bearish structure normally appears at the top of an uptrend and indicates a potential trend reversal — and that’s exactly what the current setup suggests.
Key Technical Highlights
Downside Targets
What to Expect Next?
A short pullback or retest of the neckline is possible, which may attract sellers again. As long as Nifty trades below the neckline zone, the bias stays bearish and deeper corrections remain likely.
Key Technical Highlights
- The Left Shoulder, Head, and Right Shoulder are clearly visible.
- Nifty attempted multiple bounces from the Neckline support zone (around 25,850–25,900) but failed to sustain.
- Today’s clean breakdown below this neckline confirms the reversal pattern.
- According to the projected height method, Nifty may extend its decline towards the following levels:
Downside Targets
- T1: 25,700
- T2: 25,549
- Final Projected Target: 25,450
What to Expect Next?
A short pullback or retest of the neckline is possible, which may attract sellers again. As long as Nifty trades below the neckline zone, the bias stays bearish and deeper corrections remain likely.
📈 Trade Smarter with TradZoo!
📣 Telegram: t.me/tradzooIndex
📣 Forex Telegram: t.me/tradzoofx
📲 Mobile App: tradzoo.com/download
📲 Forex App:tradzoo.com/forex/download
🔗 Website: bit.ly/tradzoopage
📣 Telegram: t.me/tradzooIndex
📣 Forex Telegram: t.me/tradzoofx
📲 Mobile App: tradzoo.com/download
📲 Forex App:tradzoo.com/forex/download
🔗 Website: bit.ly/tradzoopage
Disclaimer
The information and publications are not meant to be, and do not constitute, financial, investment, trading, or other types of advice or recommendations supplied or endorsed by TradingView. Read more in the Terms of Use.