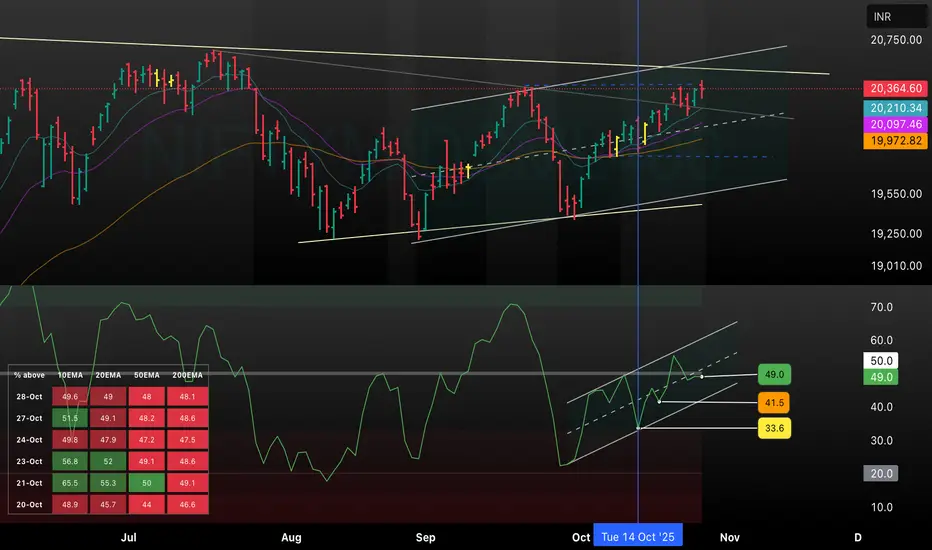
This TradingView chart provides a dual-pane analysis of the Nifty MidSmall 400 index, focusing on both price action and market breadth relative to key moving averages. The upper panel illustrates price movement within well-defined parallel channels, guided by dynamic support and resistance, and features four moving averages for trend context. The lower pane represents a custom market breadth indicator, showing the percentage of stocks above the 20, 50, and 200 EMA levels over a 7-day lookback, with clear thresholds (49, 41.5, and 33.6) for interpreting breadth strength and momentum shifts. Recent action highlights consolidation near upper resistance, while breadth readings suggest current market participation and potential inflection points useful for swing traders and trend-followers.
Disclaimer
The information and publications are not meant to be, and do not constitute, financial, investment, trading, or other types of advice or recommendations supplied or endorsed by TradingView. Read more in the Terms of Use.
Disclaimer
The information and publications are not meant to be, and do not constitute, financial, investment, trading, or other types of advice or recommendations supplied or endorsed by TradingView. Read more in the Terms of Use.