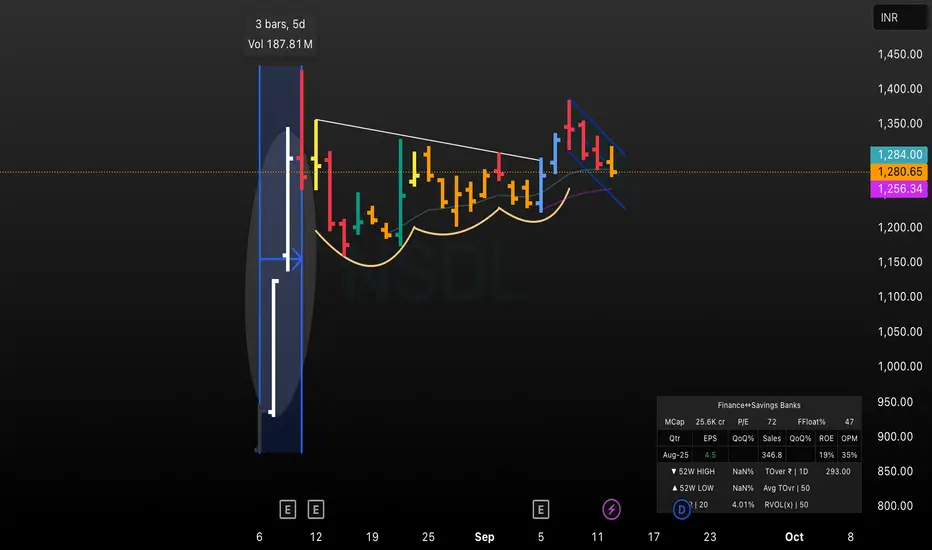
This chart highlights NSDL’s sharp volatility spike (high-volume move) followed by base formation. After explosive price action, the stock began forming higher lows, indicating accumulation. Recent price action shows a bullish setup with contracting ranges, suggesting a possible breakout above resistance. Tracking volume and price structure for next trade move is key.
Disclaimer
The information and publications are not meant to be, and do not constitute, financial, investment, trading, or other types of advice or recommendations supplied or endorsed by TradingView. Read more in the Terms of Use.
Disclaimer
The information and publications are not meant to be, and do not constitute, financial, investment, trading, or other types of advice or recommendations supplied or endorsed by TradingView. Read more in the Terms of Use.