Based on your daily candlestick pattern analysis for NTPC as of March 10, 2025, here’s a breakdown of the potential trade scenarios:
Current Setup & Key Observations:
1. Tweezers Top & Doji Formation:
2. Closing Below the Fair Value Gap (FVG: 337 - 330.50):
3. Major Trend is Bearish:
The overall trend remains bearish, supporting trend continuation instead of reversal unless price reclaims the FVG.
Bearish Scenario (10% Downside for Trend Continuation)
Bullish Scenario (Reversal Above 337 - 330.50 FVG)
Trend Reversal Condition:
Final Thought:
Disclaimer: This analysis is for informational and educational purposes only and should not be considered as financial or investment advice. Trading and investing involve risk, and past performance is not indicative of future results. Always conduct your own research and consult with a certified financial advisor before making any investment decisions. The author is not responsible for any financial losses incurred based on this analysis. Trade at your own risk.
Current Setup & Key Observations:
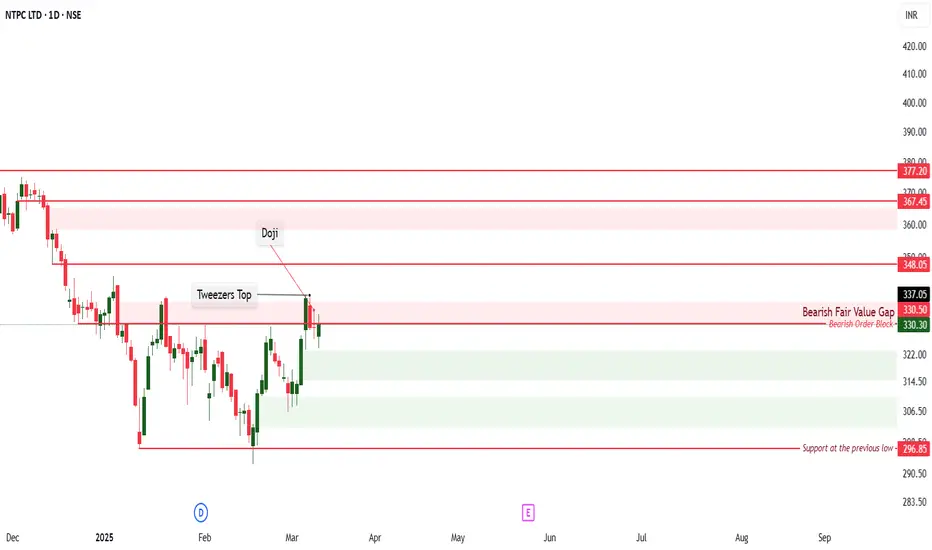
1. Tweezers Top & Doji Formation:
- A Tweezers Top indicates strong resistance and potential trend reversal.
- Three consecutive Doji candles suggest indecision but could act as a signal for further downside if the next candle confirms bearish momentum.
2. Closing Below the Fair Value Gap (FVG: 337 - 330.50):
- Price closing below 330.50 shows a failure to sustain within the FVG, confirming bearish strength.
- This suggests the possibility of a further downside move.
3. Major Trend is Bearish:
The overall trend remains bearish, supporting trend continuation instead of reversal unless price reclaims the FVG.
Bearish Scenario (10% Downside for Trend Continuation)
- A strong bearish candle below 329.40.
- Increased volume on breakdown.
- Rejection from 330.50 if price retests.
Bullish Scenario (Reversal Above 337 - 330.50 FVG)
Trend Reversal Condition:
- Price must reclaim 337 with strong bullish momentum.
- Breakout with volume above 337 signals a shift in trend.
Final Thought:
- Below 329.40: Downtrend continuation towards 296-297.
- Above 337: Bullish breakout for trend reversal.
- Inside 329.40 - 337: No clear direction → Wait for confirmation.
Disclaimer: This analysis is for informational and educational purposes only and should not be considered as financial or investment advice. Trading and investing involve risk, and past performance is not indicative of future results. Always conduct your own research and consult with a certified financial advisor before making any investment decisions. The author is not responsible for any financial losses incurred based on this analysis. Trade at your own risk.
Disclaimer
The information and publications are not meant to be, and do not constitute, financial, investment, trading, or other types of advice or recommendations supplied or endorsed by TradingView. Read more in the Terms of Use.
Disclaimer
The information and publications are not meant to be, and do not constitute, financial, investment, trading, or other types of advice or recommendations supplied or endorsed by TradingView. Read more in the Terms of Use.