Short
Wanted to buy some NULS "because fundamentals" but..
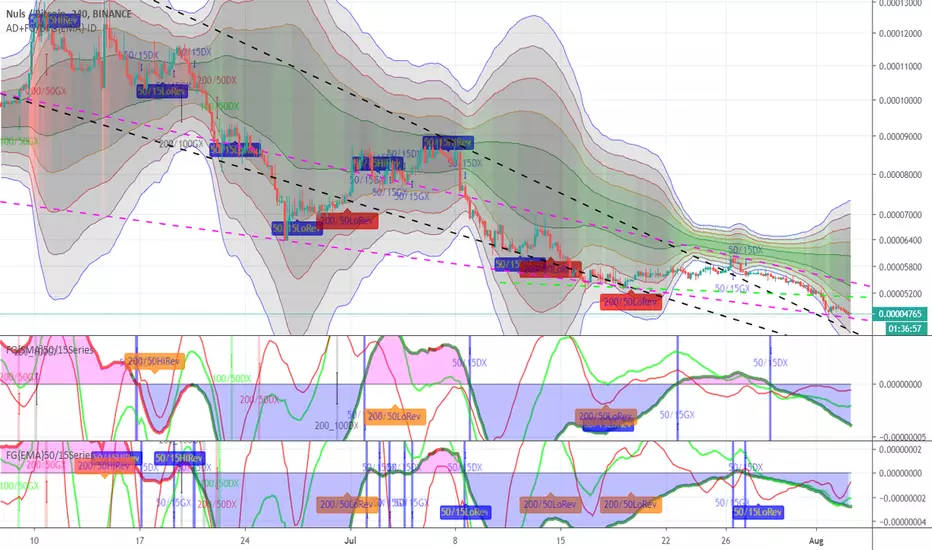
Chart looks too horrible!
Its the same with most altcoins atm.
Chart's seems bullish on BTC though.
Its the same with most altcoins atm.
Chart's seems bullish on BTC though.
Note
Will go bullish once the DIFFERENTIAL and DOUBLE-DIFFERENTIAL FUSIONGAPS (i.e. DFG and D2FG) oscillators goes positive (preferably with a steep positive slope) + price goes above the green trend line.Note
Will consider to take up an investment position, if price goes above the higher pink trend line and finds support.Note
NULS closed above the blue conversion line. Bought in a little 4hrs ago. Now the 3rd green candle in a row is forming. Will need to closely watch how the price and indicators interacts with the top pink trendline @ ~0.00005300 BTC Note
Bought in a tiny position 4hrs ago @ 0.00004848 BTC, with stop-loss set at 0.00004788 BTC. Both the FG and MAJ have or are turning bullish. With the FG acceleration oscillator crossing into the positive + both MAJ acceleration and jerk oscillators as well as the FG momentum heading sharply towards positive.
Note
Exploring Scenarios..Disclaimer
The information and publications are not meant to be, and do not constitute, financial, investment, trading, or other types of advice or recommendations supplied or endorsed by TradingView. Read more in the Terms of Use.
Disclaimer
The information and publications are not meant to be, and do not constitute, financial, investment, trading, or other types of advice or recommendations supplied or endorsed by TradingView. Read more in the Terms of Use.