There are many possible journeys for your account — some lucky, some painful. But why is it that only one of them really matters? Let’s find out.
1. A Glimpse Into the Future (With All Its Paths)
How confident would you feel if your trading plan could show you not just the average outcome you can expect, but also the good, the bad, and even the ugly roads your account might take?
In this blog, we’ve talked about expected value as the trader’s true laser vision: the ability to project the evolution of your account instead of obsessing over the price of a single trade.
Today, we’ll turn that laser forward in time. We’ll see how expectancy becomes real when trades start piling up, and how a couple of simple simulations let us peek into the different futures of a trading system.
2. The Power of Repetition: When the Average Becomes Real
A single trade tells you nothing. It may end in profit, it may end in loss — but in statistical terms, it’s just noise.
Things change once you start repeating trades under a rule-based system. Variance begins to smooth out, and the average result — expectancy — becomes visible.
Think of flipping a coin: if you flip it 5 times, you might get 4 heads and 1 tail. Misleading, right? But flip it 500 times, and the ratio will settle close to 50/50.
Trading works the same way: a system is not judged by one trade but by hundreds or thousands. And here’s where many beginners stumble: they overvalue a single outcome, feeling euphoric after a win or devastated after a loss. That emotional swing is one of the main reasons traders blow up their accounts. But judged in the bigger picture, those single dots are meaningless — what matters is the long-run average.
3. The Trap Visualized
When you look at trades one by one, the picture is chaotic. Some dots are up, some are down, scattered without a clear pattern.
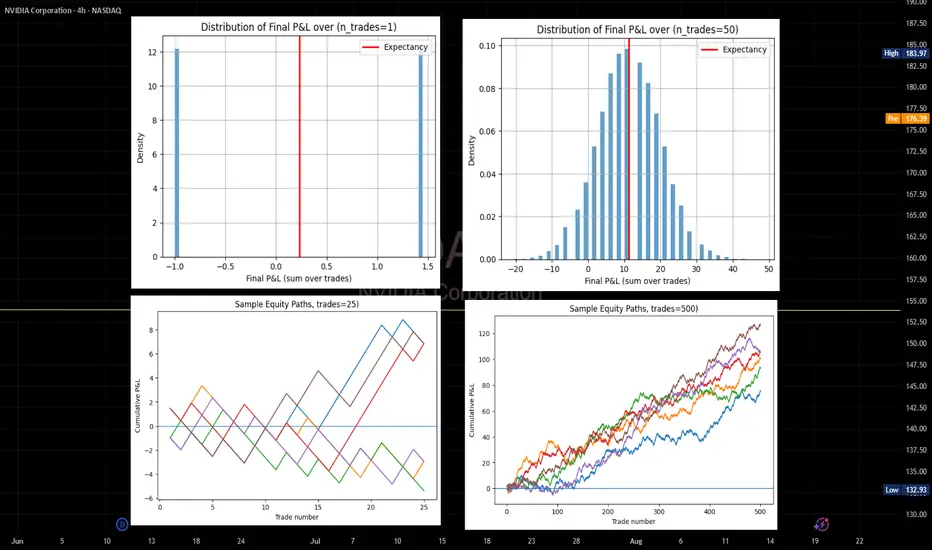
The plot at the top left is exactly what fuels emotional trading. The blue bars are single-trade outcomes — random wins and losses. The red line is expectancy. When you zoom in on just one bar, you’re focusing on noise, whether it’s a big win or a big loss. In reality, that focus is a misleading: a single trade tells you nothing about the true edge of your system.
But when you let your rule-based system play out over time, the story changes. As the top-right plot shows, trades accumulate, those scattered outcomes begin to cluster, and the distribution slowly aligns with the red line. The noise shrinks, the signal emerges, and the expectancy — the true value of your system — takes center stage.
4. From One Trade to Many: The Path of Your Account
Once we shift from a single trade to many trades, the picture changes completely. Instead of scattered dots, we now see full equity paths — different possible journeys of an account following the same rules over time.
The bottom-left plot shows that with just a handful of trades (10 or 20), the paths zigzag wildly. Some end positive, others in losses—here, luck still calls the shots!
The bottom-right plot shows that with hundreds of trades (200, 500, or more), the paths converge around the system’s true average. Luck fades away, and expectancy takes the lead.
5. Expectancy = Realistic Confidence
Together, these lessons are powerful:
A single trade means nothing — it’s just random variance.
Many trades reveal the true destiny of the system — expectancy gradually asserts itself.
This isn’t about promising that losses won’t happen. It’s about accepting that your account’s future is always a range of possible scenarios. The key fact is this: if your system has positive expectancy, mathematics is on your side — but only if you give it enough repetitions for the signal to rise above the noise.
So let me ask you: do you know the expectancy of your system? If you don’t, then trading without it isn’t just risky — it’s irresponsible.
6. Conclusion and What’s Next
So here’s the takeaway:
Expectancy is your compass.
Monte Carlo simulations are the flashlight showing you the different roads that compass might lead you down.
The future of your trading isn’t a black box. It’s a set of possible paths you can explore, measure, and prepare for.
In the next post, we’ll focus on the engine that makes expectancy work in real life: risk management. Because even with a winning system, if you risk too much on each trade, variance can knock you out of the game before expectancy has a chance to do its job.
For Readers Interested in Quantitative Trading
I have prepared a Python repository to accompany this post. You can find it on GitHub by searching for the repository name "How To Lambo." Inside, you’ll find the notebook probabilistic_trading.ipynb, which lets you experiment hands-on with the probabilistic trading concepts discussed here. Think of it as opening the hood of the car and seeing how the engine actually works.
To recreate the plots from this post:
Run monte_carlo_pnl to visualize the dispersion of single-trade outcomes. You’ll see clearly that no single result reflects the true expectancy of the system — it’s all variance.
Run plot_equity_paths with different values of n_trades. At 50 trades, the equity curves look like a jungle of chaotic, diverging paths. At 500 trades, they transform into something resembling a highway of parallel lanes — stable, predictable, and clustered around the system’s mean.
And that’s just the beginning. The notebook follows a clear conceptual line, guiding you interactively through the logic of probabilistic trading. It’s an open invitation to explore, test, and see for yourself the power of expectancy in action.
1. A Glimpse Into the Future (With All Its Paths)
How confident would you feel if your trading plan could show you not just the average outcome you can expect, but also the good, the bad, and even the ugly roads your account might take?
In this blog, we’ve talked about expected value as the trader’s true laser vision: the ability to project the evolution of your account instead of obsessing over the price of a single trade.
Today, we’ll turn that laser forward in time. We’ll see how expectancy becomes real when trades start piling up, and how a couple of simple simulations let us peek into the different futures of a trading system.
2. The Power of Repetition: When the Average Becomes Real
A single trade tells you nothing. It may end in profit, it may end in loss — but in statistical terms, it’s just noise.
Things change once you start repeating trades under a rule-based system. Variance begins to smooth out, and the average result — expectancy — becomes visible.
Think of flipping a coin: if you flip it 5 times, you might get 4 heads and 1 tail. Misleading, right? But flip it 500 times, and the ratio will settle close to 50/50.
Trading works the same way: a system is not judged by one trade but by hundreds or thousands. And here’s where many beginners stumble: they overvalue a single outcome, feeling euphoric after a win or devastated after a loss. That emotional swing is one of the main reasons traders blow up their accounts. But judged in the bigger picture, those single dots are meaningless — what matters is the long-run average.
3. The Trap Visualized
When you look at trades one by one, the picture is chaotic. Some dots are up, some are down, scattered without a clear pattern.
The plot at the top left is exactly what fuels emotional trading. The blue bars are single-trade outcomes — random wins and losses. The red line is expectancy. When you zoom in on just one bar, you’re focusing on noise, whether it’s a big win or a big loss. In reality, that focus is a misleading: a single trade tells you nothing about the true edge of your system.
But when you let your rule-based system play out over time, the story changes. As the top-right plot shows, trades accumulate, those scattered outcomes begin to cluster, and the distribution slowly aligns with the red line. The noise shrinks, the signal emerges, and the expectancy — the true value of your system — takes center stage.
4. From One Trade to Many: The Path of Your Account
Once we shift from a single trade to many trades, the picture changes completely. Instead of scattered dots, we now see full equity paths — different possible journeys of an account following the same rules over time.
The bottom-left plot shows that with just a handful of trades (10 or 20), the paths zigzag wildly. Some end positive, others in losses—here, luck still calls the shots!
The bottom-right plot shows that with hundreds of trades (200, 500, or more), the paths converge around the system’s true average. Luck fades away, and expectancy takes the lead.
5. Expectancy = Realistic Confidence
Together, these lessons are powerful:
A single trade means nothing — it’s just random variance.
Many trades reveal the true destiny of the system — expectancy gradually asserts itself.
This isn’t about promising that losses won’t happen. It’s about accepting that your account’s future is always a range of possible scenarios. The key fact is this: if your system has positive expectancy, mathematics is on your side — but only if you give it enough repetitions for the signal to rise above the noise.
So let me ask you: do you know the expectancy of your system? If you don’t, then trading without it isn’t just risky — it’s irresponsible.
6. Conclusion and What’s Next
So here’s the takeaway:
Expectancy is your compass.
Monte Carlo simulations are the flashlight showing you the different roads that compass might lead you down.
The future of your trading isn’t a black box. It’s a set of possible paths you can explore, measure, and prepare for.
In the next post, we’ll focus on the engine that makes expectancy work in real life: risk management. Because even with a winning system, if you risk too much on each trade, variance can knock you out of the game before expectancy has a chance to do its job.
For Readers Interested in Quantitative Trading
I have prepared a Python repository to accompany this post. You can find it on GitHub by searching for the repository name "How To Lambo." Inside, you’ll find the notebook probabilistic_trading.ipynb, which lets you experiment hands-on with the probabilistic trading concepts discussed here. Think of it as opening the hood of the car and seeing how the engine actually works.
To recreate the plots from this post:
Run monte_carlo_pnl to visualize the dispersion of single-trade outcomes. You’ll see clearly that no single result reflects the true expectancy of the system — it’s all variance.
Run plot_equity_paths with different values of n_trades. At 50 trades, the equity curves look like a jungle of chaotic, diverging paths. At 500 trades, they transform into something resembling a highway of parallel lanes — stable, predictable, and clustered around the system’s mean.
And that’s just the beginning. The notebook follows a clear conceptual line, guiding you interactively through the logic of probabilistic trading. It’s an open invitation to explore, test, and see for yourself the power of expectancy in action.
Disclaimer
The information and publications are not meant to be, and do not constitute, financial, investment, trading, or other types of advice or recommendations supplied or endorsed by TradingView. Read more in the Terms of Use.
Disclaimer
The information and publications are not meant to be, and do not constitute, financial, investment, trading, or other types of advice or recommendations supplied or endorsed by TradingView. Read more in the Terms of Use.