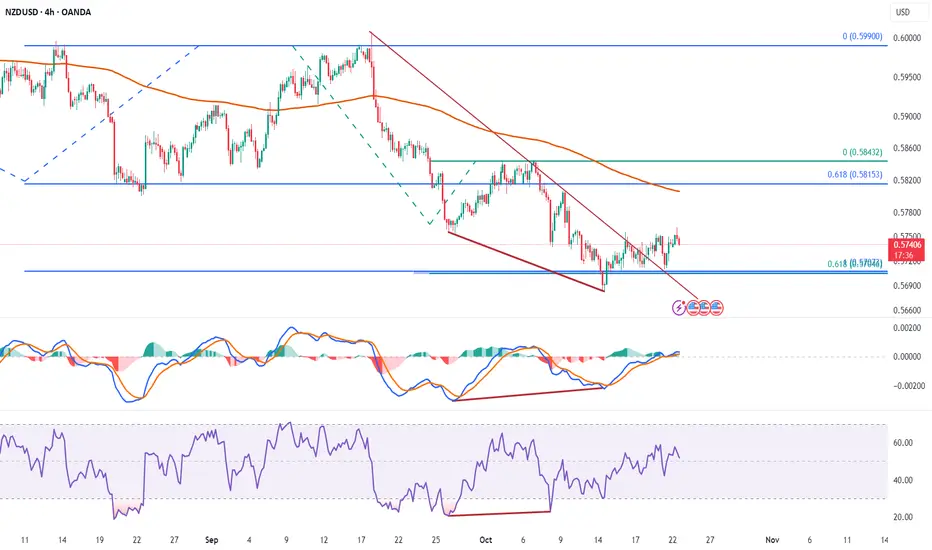
NZDUSD has been under sustained pressure for weeks but is now showing early signs of a potential major reversal. On the monthly timeframe, price has formed a triple bottom pattern, suggesting a strong accumulation phase near the 0.5700 area — a historically defended level.
On the 4H chart, price is showing exhaustion of sellers. The MACD shows a bullish crossover, and RSI confirms a bullish divergence, hinting that selling momentum is fading.
A breakout above the descending channel could confirm a medium-term trend reversal, with upside potential toward the 200 EMA and beyond.
Resistance levels:
0.6118
0.5815
0.5990
Support levels:
0.5707
0.5618
0.5532
Disclaimer
The information and publications are not meant to be, and do not constitute, financial, investment, trading, or other types of advice or recommendations supplied or endorsed by TradingView. Read more in the Terms of Use.
Disclaimer
The information and publications are not meant to be, and do not constitute, financial, investment, trading, or other types of advice or recommendations supplied or endorsed by TradingView. Read more in the Terms of Use.