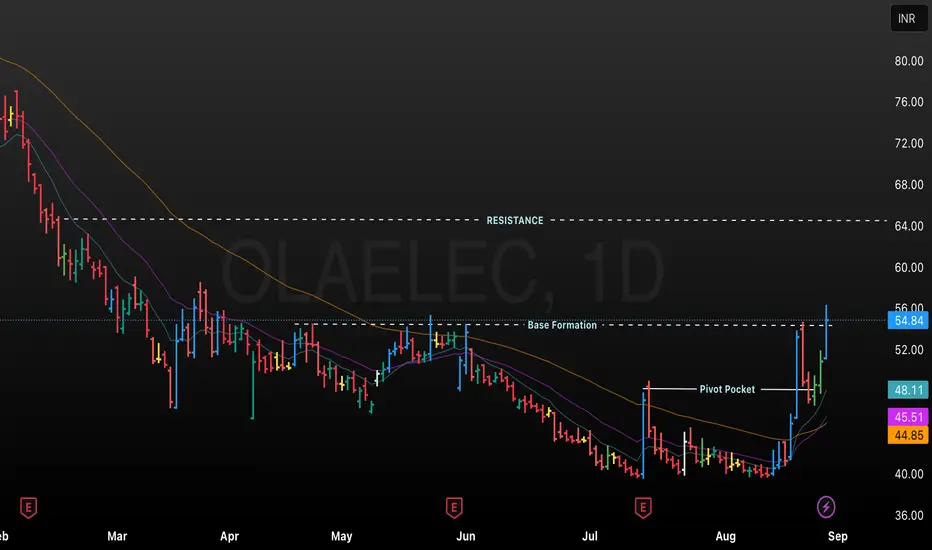
This chart displays the daily candlestick price action for OLA Electric, showing trends from February to August. Key technical levels are annotated, such as Resistance near 64, a Base Formation region, and a Pivot Pocket, indicating areas of price consolidation and breakout attempts. Moving averages (possibly 20-day, 50-day, and 200-day) are included, and the latest price is 54.84 INR, with a significant gain of +7.91% on the day. The chart is useful for analyzing support, resistance, and trend development in OLA Electric’s stock
Disclaimer
The information and publications are not meant to be, and do not constitute, financial, investment, trading, or other types of advice or recommendations supplied or endorsed by TradingView. Read more in the Terms of Use.
Disclaimer
The information and publications are not meant to be, and do not constitute, financial, investment, trading, or other types of advice or recommendations supplied or endorsed by TradingView. Read more in the Terms of Use.