After reviewing  OMC, inspired by an excellent idea posted by TopChartPatterns titled “A 10% rally is about to happen in OMC,” I decided to take a closer look at this potential investment.
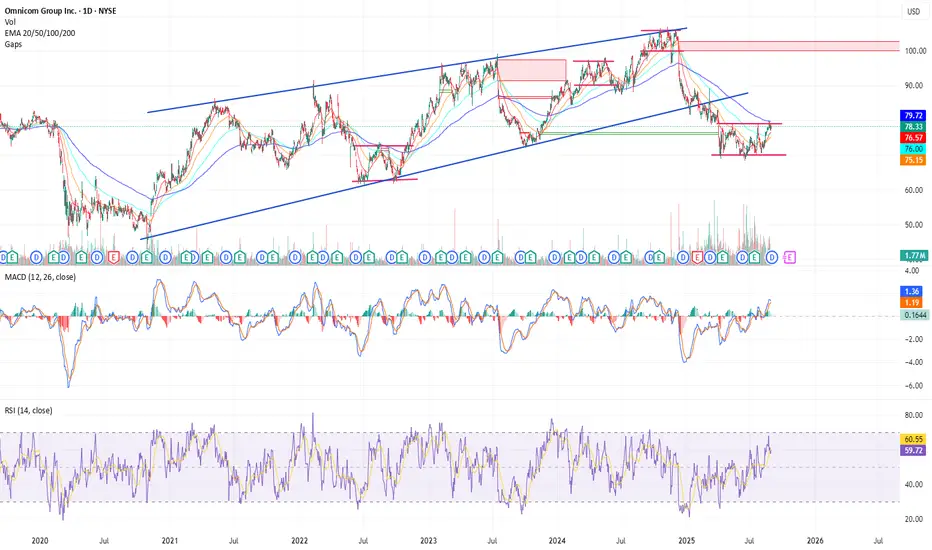
On the short-term chart,OMC is currently in a consolidation phase, forming a rectangle pattern with well-defined support and resistance levels. Key indicators, such as the MACD and a healthy RSI around 60, point toward bullish momentum. The price is trading above the 20, 50, and 100 EMAs and is now approaching the 200 EMA. In my view, a decisive breakout above the 200 EMA would serve as a strong bullish confirmation, potentially triggering a rally toward the blue resistance line and re-entering the long-standing rising wedge channel. That channel, which lasted for several years, demonstrated significant strength but was broken in February 2025 as bullish momentum across the waves visibly weakened.
In summary: with sufficient volume, a clean breakout above the $79 resistance could spark momentum buying, making the old wedge resistance line the next logical target for a retest.
On the short-term chart,
In summary: with sufficient volume, a clean breakout above the $79 resistance could spark momentum buying, making the old wedge resistance line the next logical target for a retest.
Trade active
The stock has just completed a 5-wave Elliott count, and I expect it could pull back toward the $75 zone before starting a new impulse and breaking above resistanceRelated publications
Disclaimer
The information and publications are not meant to be, and do not constitute, financial, investment, trading, or other types of advice or recommendations supplied or endorsed by TradingView. Read more in the Terms of Use.
Related publications
Disclaimer
The information and publications are not meant to be, and do not constitute, financial, investment, trading, or other types of advice or recommendations supplied or endorsed by TradingView. Read more in the Terms of Use.