Patanjali Chart Structure & Price Action
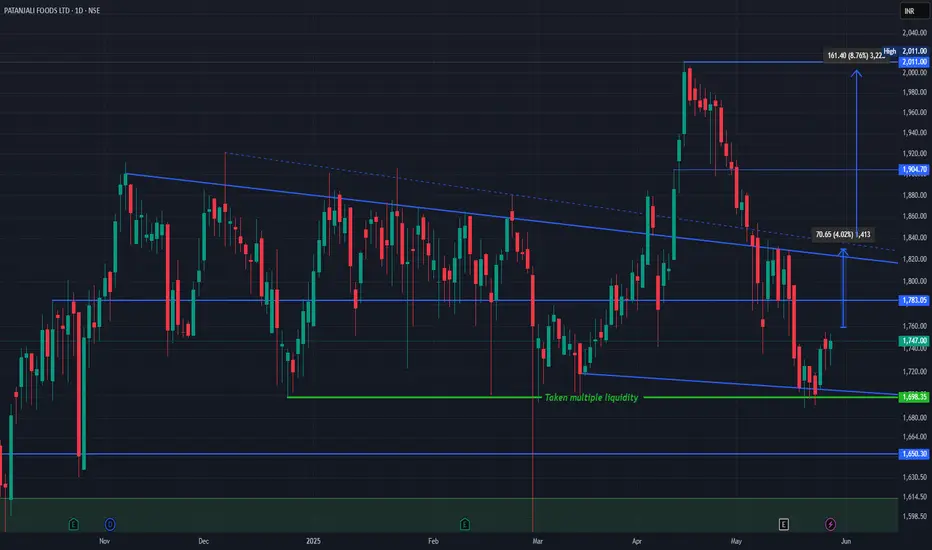
The stock has been trading within a descending channel, bounded by the blue trendlines.
It recently bounced from a major demand zone (~₹1,698) marked by the green support line that has absorbed liquidity multiple times ("Taken multiple liquidity").
Price is now slowly recovering from this base.
Current Scenario
CMP: ₹1,747
Immediate Resistance:
₹1,783 (horizontal level)
₹1,818–₹1,835 zone (upper boundary of the falling channel)
Break and sustain above ₹1,783–₹1,835 could trigger a trend reversal.
Upside Targets
Target 1: ₹1,830/Target 2: ₹1,904
Previous structural high Target 3: ₹2,011 Recent swing high Total upside from breakout: ~8.76%
Support Levels
₹1,698 – Critical demand zone (green)
₹1,650 – Next strong support
₹1,570 – Long-term support base (green zone)
Simple Explanation
Patanjali Foods rebounded from a high-liquidity support area and is now showing signs of bullish recovery. A breakout above ₹1,783 could take it back to the ₹1,900–₹2,000 range. Risk is well-defined below ₹1,698. Watch for volume and price action confirmation near the upper channel.
Like, comment your thoughts, and share this post
Explore more stock ideas on the right hand side your feedback means a lot to me!
Disclaimer: This post is for educational purposes only and should not be considered a buy/sell recommendation.
Trade active
Trade closed: stop reached
LOW RISK? PLAY HUGE!
Follow for latest updates and valuable financial content
✆ t.me/iVishalPal
Yt: t.ly/frb4G
LinkedIn: t.ly/g_SjB
WhatsApp: t.ly/_6T9j
TradingView: t.ly/-UGgZ
Telegram: t.me/traderpulseyt
Follow for latest updates and valuable financial content
✆ t.me/iVishalPal
Yt: t.ly/frb4G
LinkedIn: t.ly/g_SjB
WhatsApp: t.ly/_6T9j
TradingView: t.ly/-UGgZ
Telegram: t.me/traderpulseyt
Related publications
Disclaimer
The information and publications are not meant to be, and do not constitute, financial, investment, trading, or other types of advice or recommendations supplied or endorsed by TradingView. Read more in the Terms of Use.