#Persistent Systems Limited - Technical Analysis
Chart Overview
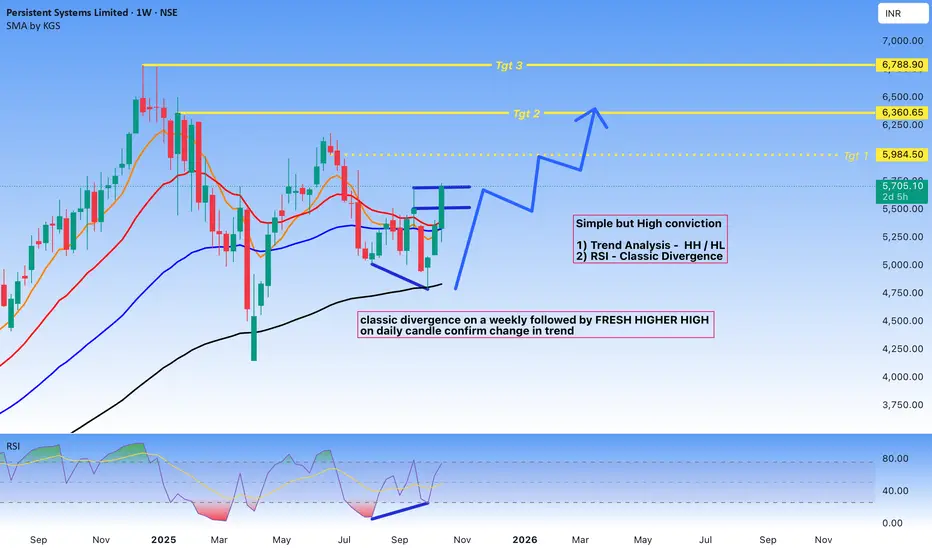
**Timeframe:** Weekly (1W)
**Current Price:** 5,708.20
Technical Setup
Trend Analysis
The chart displays a compelling technical setup based on higher highs and higher lows pattern analysis. After a significant correction from previous highs, the stock has formed a strong base and is showing signs of trend reversal.
Key Observations
RSI Classic Divergence
The Relative Strength Index is displaying a classic bullish divergence pattern. While price action formed lower lows during the correction phase, the RSI formed higher lows, indicating weakening bearish momentum and potential trend reversal. This divergence has been confirmed on the weekly timeframe, adding significant weight to the bullish case.
Fresh Higher High Confirmation:
Following the divergence, price action has broken above the previous swing high on the daily candle, confirming a potential change in trend structure. This break represents a shift from the previous pattern of lower highs and suggests renewed bullish momentum.
Price Targets
The analysis identifies three potential target zones:
- **Target 1:** 5,984.50 (Immediate resistance)
- **Target 2:** 6,360.65 (Medium-term target)
- **Target 3:** 6,788.90 (Extended target)
These targets are derived from previous resistance levels and Fibonacci extension analysis.
Moving Averages:
The chart shows multiple moving averages (likely 50 SMA and 200 SMA based on the red and orange lines). Price is currently attempting to reclaim these key moving averages, which would further validate the bullish thesis.
Risk Considerations
While the technical setup appears favorable, traders should consider:
- Confirmation on higher timeframes for reduced false signal risk
- Volume analysis to validate the breakout
- Proper risk management with stop-loss placement below recent swing lows
## Disclaimer
This is a technical analysis for educational purposes only and should not be considered as financial advice. Always conduct your own research and consult with a qualified financial advisor before making investment decisions. Past performance does not guarantee future results.
Chart Overview
**Timeframe:** Weekly (1W)
**Current Price:** 5,708.20
Technical Setup
Trend Analysis
The chart displays a compelling technical setup based on higher highs and higher lows pattern analysis. After a significant correction from previous highs, the stock has formed a strong base and is showing signs of trend reversal.
Key Observations
RSI Classic Divergence
The Relative Strength Index is displaying a classic bullish divergence pattern. While price action formed lower lows during the correction phase, the RSI formed higher lows, indicating weakening bearish momentum and potential trend reversal. This divergence has been confirmed on the weekly timeframe, adding significant weight to the bullish case.
Fresh Higher High Confirmation:
Following the divergence, price action has broken above the previous swing high on the daily candle, confirming a potential change in trend structure. This break represents a shift from the previous pattern of lower highs and suggests renewed bullish momentum.
Price Targets
The analysis identifies three potential target zones:
- **Target 1:** 5,984.50 (Immediate resistance)
- **Target 2:** 6,360.65 (Medium-term target)
- **Target 3:** 6,788.90 (Extended target)
These targets are derived from previous resistance levels and Fibonacci extension analysis.
Moving Averages:
The chart shows multiple moving averages (likely 50 SMA and 200 SMA based on the red and orange lines). Price is currently attempting to reclaim these key moving averages, which would further validate the bullish thesis.
Risk Considerations
While the technical setup appears favorable, traders should consider:
- Confirmation on higher timeframes for reduced false signal risk
- Volume analysis to validate the breakout
- Proper risk management with stop-loss placement below recent swing lows
## Disclaimer
This is a technical analysis for educational purposes only and should not be considered as financial advice. Always conduct your own research and consult with a qualified financial advisor before making investment decisions. Past performance does not guarantee future results.
Trade active
Target 1 done, now moving towards 2ndRelated publications
Disclaimer
The information and publications are not meant to be, and do not constitute, financial, investment, trading, or other types of advice or recommendations supplied or endorsed by TradingView. Read more in the Terms of Use.
Related publications
Disclaimer
The information and publications are not meant to be, and do not constitute, financial, investment, trading, or other types of advice or recommendations supplied or endorsed by TradingView. Read more in the Terms of Use.