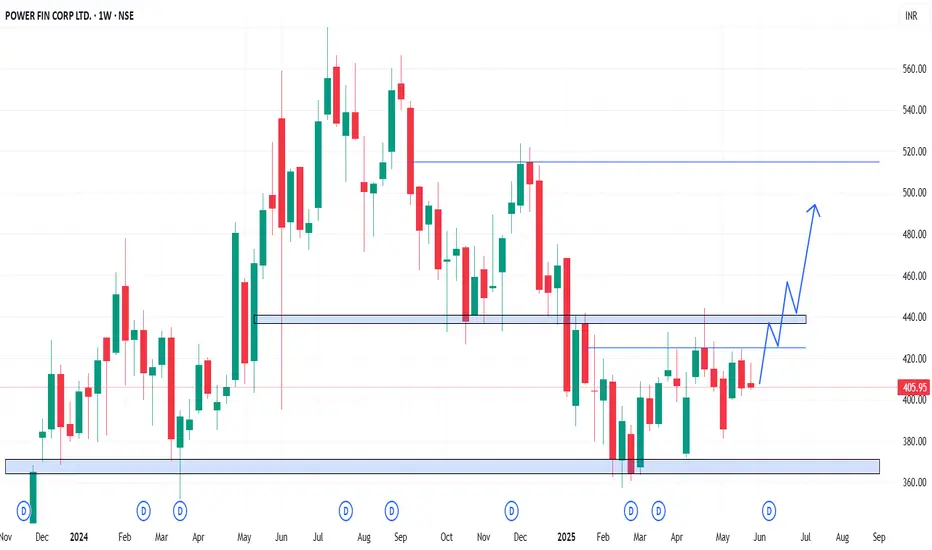
In the Weekly Chart of PFC ,
we can see that; 420-425 levels has shown strong rejection but selling has not been strong as per rejection.
Above 420 it ill bullish till 520 levels.
Trade as per your and Analysis
Expected momentum is shown in chart.
we can see that; 420-425 levels has shown strong rejection but selling has not been strong as per rejection.
Above 420 it ill bullish till 520 levels.
Trade as per your and Analysis
Expected momentum is shown in chart.
Disclaimer
The information and publications are not meant to be, and do not constitute, financial, investment, trading, or other types of advice or recommendations supplied or endorsed by TradingView. Read more in the Terms of Use.
Disclaimer
The information and publications are not meant to be, and do not constitute, financial, investment, trading, or other types of advice or recommendations supplied or endorsed by TradingView. Read more in the Terms of Use.