If
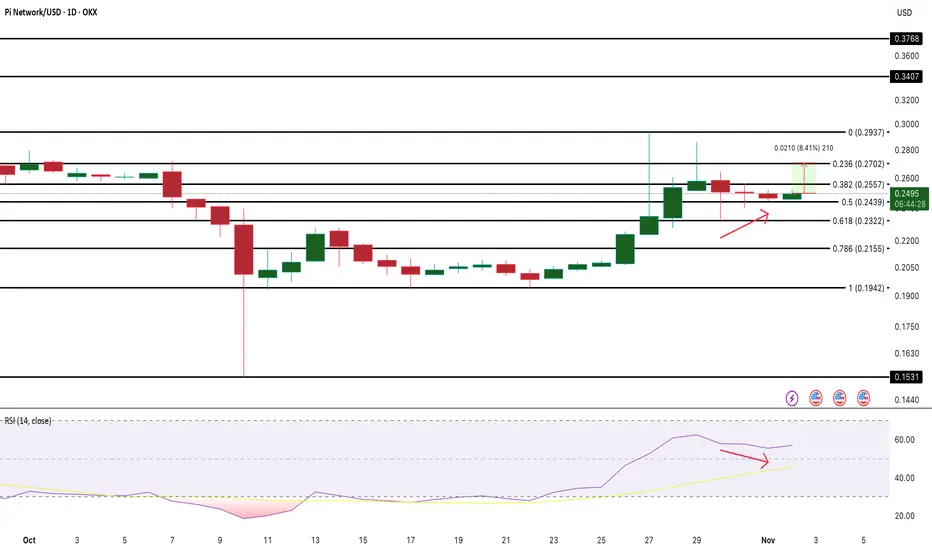
However, a drop below $0.215 would weaken this setup and risk a deeper correction toward $0.194.
On the 4-hour chart, an extra layer of confirmation is emerging — the 50-period Exponential Moving Average (EMA) is closing in on the 200-EMA from below.
If this golden crossover completes, it would further validate the strength seen on the daily timeframe and hint at continued upside momentum.
For now, the chart shows a cautious but steady rebound, with hidden bullish divergence and an impending EMA crossover giving Pi Coin bulls some reason to stay hopeful.
Leader in crypto news, award winning journalism in 26 languages.
Disclaimer
The information and publications are not meant to be, and do not constitute, financial, investment, trading, or other types of advice or recommendations supplied or endorsed by TradingView. Read more in the Terms of Use.
Leader in crypto news, award winning journalism in 26 languages.
Disclaimer
The information and publications are not meant to be, and do not constitute, financial, investment, trading, or other types of advice or recommendations supplied or endorsed by TradingView. Read more in the Terms of Use.