Pi Coin (PI) is holding near $0.208, down almost 1% in the past 24 hours and more than 53% in three months. Retail buyers are trying to hold the line, but chart signals suggest more downside ahead.
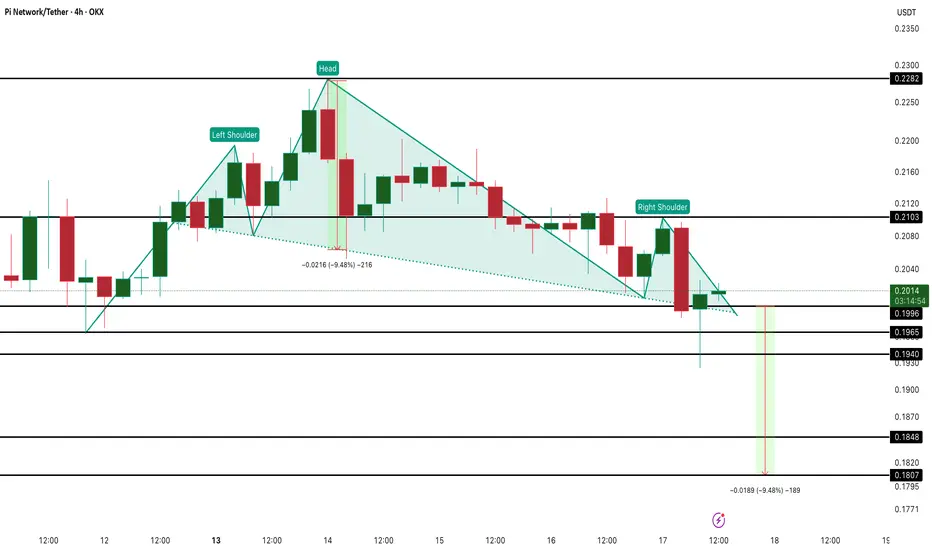
On the 4-hour chart, Pi Coin is forming a head-and-shoulders pattern, a setup that often signals a breakdown inside a broader downtrend. The neckline sits around $0.199, and a fall below $0.196 could trigger a 9.5% drop toward $0.180.
The Money Flow Index (MFI) shows retail inflows improving slightly, forming a small bullish divergence — meaning dip-buying continues. But the Relative Strength Index (RSI) tells a different story. Between October 6 and 13, RSI made a higher high while price made a lower high, forming a hidden bearish divergence that points to fading momentum.
The Chaikin Money Flow (CMF) also remains under zero, showing weak large-wallet interest. For bulls to regain control, Pi must close above $0.210 — and a true reversal would need a breakout past $0.228. Until then, the pressure under $0.19 keeps the risk tilted to the downside.
Leader in crypto news, award winning journalism in 26 languages.
Disclaimer
The information and publications are not meant to be, and do not constitute, financial, investment, trading, or other types of advice or recommendations supplied or endorsed by TradingView. Read more in the Terms of Use.
Leader in crypto news, award winning journalism in 26 languages.
Disclaimer
The information and publications are not meant to be, and do not constitute, financial, investment, trading, or other types of advice or recommendations supplied or endorsed by TradingView. Read more in the Terms of Use.