Semiconductor designer Qualcomm  QCOM , which is known for providing products to the consumer-electronics industry, rose more than 11% to a 15-month high in a single day last week when it announced a pivot into the world of artificial intelligence. Let's see what QCOM's chart and fundamentals say following the news and ahead of this week's earnings release.
Qualcomm's Fundamental Analysis
QCOM plans to release fiscal Q4 numbers after the market close on Wednesday, with Wall Street currently looking for $2.86 in adjusted earnings per share on roughly $10.75 billion of revenue.
That would represent a 6.3% annual gain in earnings from the $2.69 in adjusted EPS that QCOM reported in the same period last year. Revenue would likewise have risen some 5% from about $10.24 billion a year earlier.
In fact, 16 of the 26 sell-side analysts that I know of that cover this name have revised their earnings estimates higher since the quarter began, while only nine have lowered their projections. (One estimate remains unchanged.)
Of course, markets will also want to hear management's commentary on the shift to AI, which will put Qualcomm in head-to-head competition with likes of Nvidia NVDA and Advanced Micro Devices
  AMD .
AMD .
Qualcomm's Technical Analysis
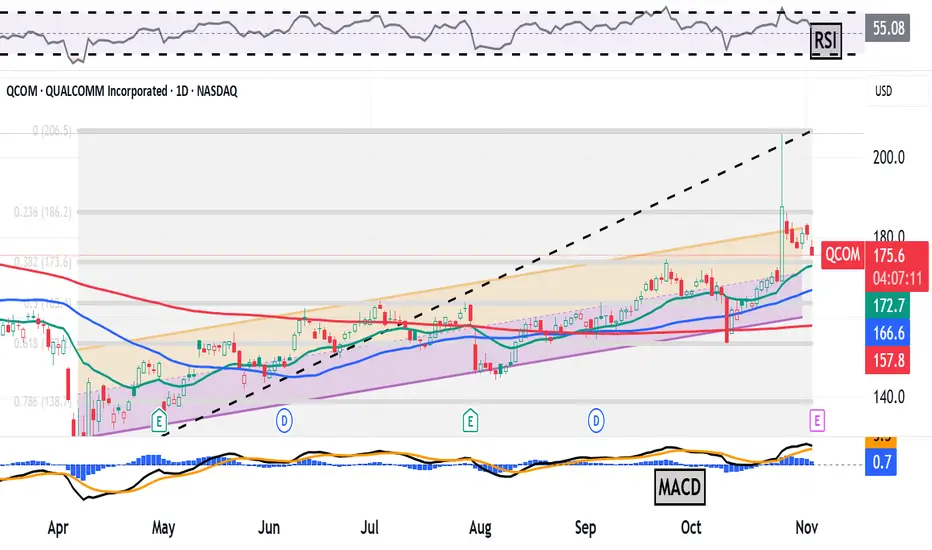
Now let's look at QCOM's chart going back some eight months and running through Friday afternoon:

Readers will see that Qualcomm rose 70.5% between hitting a 17-month intraday low of $120.80 on April 7 and a $205.95 session high on Oct. 27 following the AI announcement.
Still, QCOM has for the most part methodically traded during this whole period within the confines of the Raff Regression model that I created above (marked with orange and pink fields).
That said, the stock has come in some after its Oct. 27 blow-off top -- perhaps because Qualcomm's new AI-friendly chips won't be ready for a number of months.
As QCOM pulled back, it felt around for support close to the 38.2% Fibonacci-sequence retracement level of the stock's entire 2025 rally (marked with gray shading in the chart above).
That's the downside pivot here, but there's technical help for Qualcomm not far below the 38.2% Fib level.
QCOM's 21-day Exponential Moving Average (or "EMA," marked with a green line at $171.60) lies nearby. That's where we might find out if the swing crowd is on board with Qualcomm's recent upward move.
If not, Qualcomm's 50-day Simple Moving Average (or "SMA," denoted with a blue line) and its 200-day SMA (the red line) aren't far below the 21-day EMA.
Those are levels where the professional money managers might be, so there's plenty of possible support for QCOM indicated in the chart above.
All in, Qualcomm's upside pivot could be the stock's recent $205.95 high. Conversely, the stock's downside pivot could be that 38.2% Fib level.
As for the stock's secondary technical indicators, Qualcomm's Relative Strength Index (the gray line at the chart's top) is quite robust, yet not overbought technically.
Meanwhile, the stock's daily Moving Average Convergence Divergence indicator (or "MACD," denoted by black and gold lines and blue bars at the chart's bottom) is overtly bullish.
Within the MACD, the histogram of the 9-day EMA is well into positive territory, while the 12-day EMA rides above the 26-day EMA and both are above the zero-bound. Those are all bullish technical signals.
An Options Option
Options traders who want to go long on QCOM while getting paid to take on equity risk might utilize what's called a "bull-put spread."
This is constructed by selling one put and buying a second one with a lower strike, but the same expiration date. Here's an example:
-- Sell one QCOM $175 put with a Nov. 7 expiration date (i.e. after this week's earnings). This costs about $3.75.
-- Buy one QCOM Nov. 7 $165 put for roughly $1.30.
Net Credit: $2.45
Should Qualcomm -- which closed at $180.72 Monday -- never trade as low as $175 prior to the options' Nov. 7 expiration, the trader will simply pocket the $2.45 net credit.
And should the stock trade below $175 at expiration but not below $165, the trader would end up long 100 shares of QCOM at a $172.55.
But what if the shares take a serious beating between now and Nov. 7? Well, if QCOM drops below $165 at expiration, the trader in the example above would have lost $10 on the equity trade less the $2.45 net credit for the bull-put spread. That works out to a $7.55 net loss.
(Moomoo Technologies Inc. Markets Commentator Stephen "Sarge" Guilfoyle had no position in QCOM at the time of writing this column, but was long NVDA and AMD.)
This article discusses technical analysis, other approaches, including fundamental analysis, may offer very different views. The examples provided are for illustrative purposes only and are not intended to be reflective of the results you can expect to achieve. Specific security charts used are for illustrative purposes only and are not a recommendation, offer to sell, or a solicitation of an offer to buy any security. Past investment performance does not indicate or guarantee future success. Returns will vary, and all investments carry risks, including loss of principal. This content is also not a research report and is not intended to serve as the basis for any investment decision. The information contained in this article does not purport to be a complete description of the securities, markets, or developments referred to in this material. Moomoo and its affiliates make no representation or warranty as to the article's adequacy, completeness, accuracy or timeliness for any particular purpose of the above content. Furthermore, there is no guarantee that any statements, estimates, price targets, opinions or forecasts provided herein will prove to be correct.
Options trading is risky and not appropriate for everyone. Read the Options Disclosure Document (https://j.moomoo.com/017y9J) before trading. Options are complex and you may quickly lose the entire investment. Supporting docs for any claims will be furnished upon request.
Options trading subject to eligibility requirements. Strategies available will depend on options level approved.
Maximum potential loss and profit for options are calculated based on the single leg or an entire multi-leg trade remaining intact until expiration with no option contracts being exercised or assigned. These figures do not account for a portion of a multi-leg strategy being changed or removed or the trader assuming a short or long position in the underlying stock at or before expiration. Therefore, it is possible to lose more than the theoretical max loss of a strategy.
Moomoo is a financial information and trading app offered by Moomoo Technologies Inc. In the U.S., investment products and services on Moomoo are offered by Moomoo Financial Inc., Member FINRA/SIPC.
TradingView is an independent third party not affiliated with Moomoo Financial Inc., Moomoo Technologies Inc., or its affiliates. Moomoo Financial Inc. and its affiliates do not endorse, represent or warrant the completeness and accuracy of the data and information available on the TradingView platform and are not responsible for any services provided by the third-party platform.
Qualcomm's Fundamental Analysis
QCOM plans to release fiscal Q4 numbers after the market close on Wednesday, with Wall Street currently looking for $2.86 in adjusted earnings per share on roughly $10.75 billion of revenue.
That would represent a 6.3% annual gain in earnings from the $2.69 in adjusted EPS that QCOM reported in the same period last year. Revenue would likewise have risen some 5% from about $10.24 billion a year earlier.
In fact, 16 of the 26 sell-side analysts that I know of that cover this name have revised their earnings estimates higher since the quarter began, while only nine have lowered their projections. (One estimate remains unchanged.)
Of course, markets will also want to hear management's commentary on the shift to AI, which will put Qualcomm in head-to-head competition with likes of Nvidia
Qualcomm's Technical Analysis
Now let's look at QCOM's chart going back some eight months and running through Friday afternoon:
Readers will see that Qualcomm rose 70.5% between hitting a 17-month intraday low of $120.80 on April 7 and a $205.95 session high on Oct. 27 following the AI announcement.
Still, QCOM has for the most part methodically traded during this whole period within the confines of the Raff Regression model that I created above (marked with orange and pink fields).
That said, the stock has come in some after its Oct. 27 blow-off top -- perhaps because Qualcomm's new AI-friendly chips won't be ready for a number of months.
As QCOM pulled back, it felt around for support close to the 38.2% Fibonacci-sequence retracement level of the stock's entire 2025 rally (marked with gray shading in the chart above).
That's the downside pivot here, but there's technical help for Qualcomm not far below the 38.2% Fib level.
QCOM's 21-day Exponential Moving Average (or "EMA," marked with a green line at $171.60) lies nearby. That's where we might find out if the swing crowd is on board with Qualcomm's recent upward move.
If not, Qualcomm's 50-day Simple Moving Average (or "SMA," denoted with a blue line) and its 200-day SMA (the red line) aren't far below the 21-day EMA.
Those are levels where the professional money managers might be, so there's plenty of possible support for QCOM indicated in the chart above.
All in, Qualcomm's upside pivot could be the stock's recent $205.95 high. Conversely, the stock's downside pivot could be that 38.2% Fib level.
As for the stock's secondary technical indicators, Qualcomm's Relative Strength Index (the gray line at the chart's top) is quite robust, yet not overbought technically.
Meanwhile, the stock's daily Moving Average Convergence Divergence indicator (or "MACD," denoted by black and gold lines and blue bars at the chart's bottom) is overtly bullish.
Within the MACD, the histogram of the 9-day EMA is well into positive territory, while the 12-day EMA rides above the 26-day EMA and both are above the zero-bound. Those are all bullish technical signals.
An Options Option
Options traders who want to go long on QCOM while getting paid to take on equity risk might utilize what's called a "bull-put spread."
This is constructed by selling one put and buying a second one with a lower strike, but the same expiration date. Here's an example:
-- Sell one QCOM $175 put with a Nov. 7 expiration date (i.e. after this week's earnings). This costs about $3.75.
-- Buy one QCOM Nov. 7 $165 put for roughly $1.30.
Net Credit: $2.45
Should Qualcomm -- which closed at $180.72 Monday -- never trade as low as $175 prior to the options' Nov. 7 expiration, the trader will simply pocket the $2.45 net credit.
And should the stock trade below $175 at expiration but not below $165, the trader would end up long 100 shares of QCOM at a $172.55.
But what if the shares take a serious beating between now and Nov. 7? Well, if QCOM drops below $165 at expiration, the trader in the example above would have lost $10 on the equity trade less the $2.45 net credit for the bull-put spread. That works out to a $7.55 net loss.
(Moomoo Technologies Inc. Markets Commentator Stephen "Sarge" Guilfoyle had no position in QCOM at the time of writing this column, but was long NVDA and AMD.)
This article discusses technical analysis, other approaches, including fundamental analysis, may offer very different views. The examples provided are for illustrative purposes only and are not intended to be reflective of the results you can expect to achieve. Specific security charts used are for illustrative purposes only and are not a recommendation, offer to sell, or a solicitation of an offer to buy any security. Past investment performance does not indicate or guarantee future success. Returns will vary, and all investments carry risks, including loss of principal. This content is also not a research report and is not intended to serve as the basis for any investment decision. The information contained in this article does not purport to be a complete description of the securities, markets, or developments referred to in this material. Moomoo and its affiliates make no representation or warranty as to the article's adequacy, completeness, accuracy or timeliness for any particular purpose of the above content. Furthermore, there is no guarantee that any statements, estimates, price targets, opinions or forecasts provided herein will prove to be correct.
Options trading is risky and not appropriate for everyone. Read the Options Disclosure Document (https://j.moomoo.com/017y9J) before trading. Options are complex and you may quickly lose the entire investment. Supporting docs for any claims will be furnished upon request.
Options trading subject to eligibility requirements. Strategies available will depend on options level approved.
Maximum potential loss and profit for options are calculated based on the single leg or an entire multi-leg trade remaining intact until expiration with no option contracts being exercised or assigned. These figures do not account for a portion of a multi-leg strategy being changed or removed or the trader assuming a short or long position in the underlying stock at or before expiration. Therefore, it is possible to lose more than the theoretical max loss of a strategy.
Moomoo is a financial information and trading app offered by Moomoo Technologies Inc. In the U.S., investment products and services on Moomoo are offered by Moomoo Financial Inc., Member FINRA/SIPC.
TradingView is an independent third party not affiliated with Moomoo Financial Inc., Moomoo Technologies Inc., or its affiliates. Moomoo Financial Inc. and its affiliates do not endorse, represent or warrant the completeness and accuracy of the data and information available on the TradingView platform and are not responsible for any services provided by the third-party platform.
Disclaimer
The information and publications are not meant to be, and do not constitute, financial, investment, trading, or other types of advice or recommendations supplied or endorsed by TradingView. Read more in the Terms of Use.
Disclaimer
The information and publications are not meant to be, and do not constitute, financial, investment, trading, or other types of advice or recommendations supplied or endorsed by TradingView. Read more in the Terms of Use.