📊Supply & Demand View 📊
Supply and demand zones are essentially institutional footprints. Large players never execute their full orders at once; instead, they build positions in chunks. This behavior leaves behind visible imbalances on the chart. Whenever price revisits these zones, strong reactions are often seen.

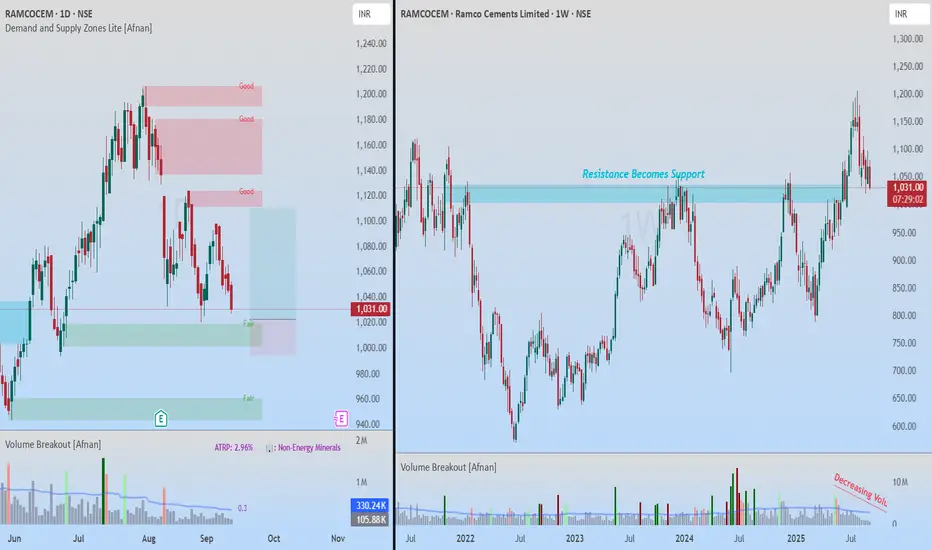
On the daily chart of Ramco Cements, price has reacted multiple times near a demand zone without fully testing it. Each time, we witnessed a bounce — a sign of heavy buying interest.
Now, the stock is once again approaching this zone for the third time, which statistically makes it a strong area to monitor. The weekly chart structure also shows higher highs and higher lows, signaling that the broader trend is bullish. With no immediate higher timeframe supply overhead, the setup offers a 1:3 favorable risk-to-reward scenario.
🚀 Breakout Retest View 🚀

On the weekly chart, Ramco Cements displays a textbook breakout retest. After years of respecting a major resistance level, price finally broke out, created fresh all-time highs, and is now pulling back to retest that very level.
This aligns perfectly with the principle of polarity: old resistance often flips into strong support.
Volume adds further conviction. Post-breakout, volume has been drying up during the pullback — an indication that sellers lack conviction.
✨ Final Takeaway ✨
Both perspectives — demand zone strength and breakout retest confirmation — are aligning bullishly. This confluence strengthens the case for Ramco Cements to resume its upward journey.
💡 Risk Management Reminder 💡
While the setup looks strong, risk management remains key. Always use SL and size positions carefully. Even the best setups can fail, but disciplined risk control ensures long-term success.
🔄 Stay disciplined, stay consistent — the market rewards those who wait! 🔄
This analysis is purely for educational purposes and is not intended as a trading or investment recommendation. I am not a SEBI registered analyst.
Supply and demand zones are essentially institutional footprints. Large players never execute their full orders at once; instead, they build positions in chunks. This behavior leaves behind visible imbalances on the chart. Whenever price revisits these zones, strong reactions are often seen.
On the daily chart of Ramco Cements, price has reacted multiple times near a demand zone without fully testing it. Each time, we witnessed a bounce — a sign of heavy buying interest.
Now, the stock is once again approaching this zone for the third time, which statistically makes it a strong area to monitor. The weekly chart structure also shows higher highs and higher lows, signaling that the broader trend is bullish. With no immediate higher timeframe supply overhead, the setup offers a 1:3 favorable risk-to-reward scenario.
🚀 Breakout Retest View 🚀
On the weekly chart, Ramco Cements displays a textbook breakout retest. After years of respecting a major resistance level, price finally broke out, created fresh all-time highs, and is now pulling back to retest that very level.
This aligns perfectly with the principle of polarity: old resistance often flips into strong support.
Volume adds further conviction. Post-breakout, volume has been drying up during the pullback — an indication that sellers lack conviction.
✨ Final Takeaway ✨
Both perspectives — demand zone strength and breakout retest confirmation — are aligning bullishly. This confluence strengthens the case for Ramco Cements to resume its upward journey.
💡 Risk Management Reminder 💡
While the setup looks strong, risk management remains key. Always use SL and size positions carefully. Even the best setups can fail, but disciplined risk control ensures long-term success.
“In trading, patience and discipline are often the real edge.”
🔄 Stay disciplined, stay consistent — the market rewards those who wait! 🔄
This analysis is purely for educational purposes and is not intended as a trading or investment recommendation. I am not a SEBI registered analyst.
Access the powerful Demand and Supply Zone Pro indicator at:
marketup2date.com
Stay updated on Telegram:
t.me/MarketUp2Date
Join our WhatsApp channel:
whatsapp.com/channel/0029Va6ByyH0LKZCc4Az4x0u
marketup2date.com
Stay updated on Telegram:
t.me/MarketUp2Date
Join our WhatsApp channel:
whatsapp.com/channel/0029Va6ByyH0LKZCc4Az4x0u
Related publications
Disclaimer
The information and publications are not meant to be, and do not constitute, financial, investment, trading, or other types of advice or recommendations supplied or endorsed by TradingView. Read more in the Terms of Use.