This stock is displaying one of the most powerful bullish technical signals possible: a decisive breakout from a 25-year angular resistance trendline. This is a major, long-term secular trend change.
📈 1. The Long-Term Context
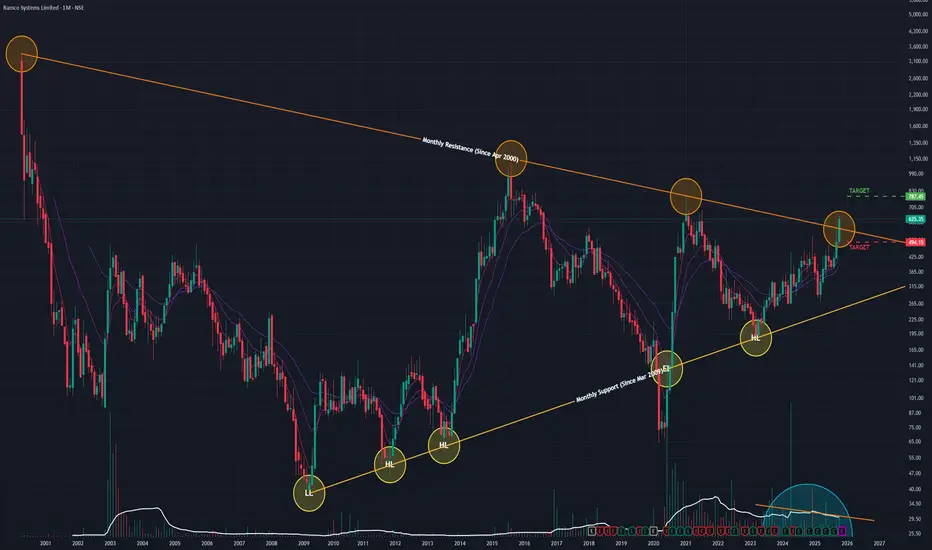
- The 25-Year Pattern: Since its peak in April 2000, the stock has been held down by a massive, multi-decade angular resistance trendline.
- The Bottom & Reversal:The stock formed its ultimate bottom in March 2009. Since then, it has been in a slow, 16-year recovery, forming a pattern of Higher Lows against this unbreachable resistance.
- Volume Contraction: Volume was declining (or contracting) during the final phases of this consolidation. This is a classic sign of seller exhaustion right before a major breakout.
🚀 2. The Decisive Breakout
In October 2025, this 25-year pattern was shattered:
- The Surge: The stock surged +26.61% in a single month.
- High-Conviction Volume: This move was backed by a massive spike in volume (2.77 Million shares), confirming strong institutional interest and the validity of the breakout.
- The Close: Most importantly, the stock closed firmly above the 25-year trendline, signaling the "lid" has finally been broken.
📊 3. Key Technical Indicators
The underlying momentum supports this new long-term trend:
- RSI: The Relative Strength Index is rising, showing that strong buying momentum is accelerating.
- EMAs: The short-term Exponential Moving Averages are in a "PCO" (Price Crossover) state, confirming the new bullish trend is in effect across timeframes.
🎯 4. Future Scenarios & Key Levels to Watch
This breakout provides a very clear road map.
🐂 The Bullish Case (Confirmation)
- Confirmation: The "gold standard" for a breakout of this magnitude is a successful "re-test." We want to see the price pull back to the old trendline (now new support, around ₹560) and "bounce," confirming the breakout is genuine.
- Target: Once confirmed, the next logical technical price target is ₹787.
🐻 The Bearish Case (Breakout Failure)
- Trigger: If the momentum is not sustained, and the breakout is a "fakeout" (a "bull trap").
- Confirmation: The stock fails to hold its gains and closes back below the broken trendline (around ₹560 support level) on high volume.
- Target: This failure would invalidate the immediate thesis and likely lead to a sharp sell-off.
📈 1. The Long-Term Context
- The 25-Year Pattern: Since its peak in April 2000, the stock has been held down by a massive, multi-decade angular resistance trendline.
- The Bottom & Reversal:The stock formed its ultimate bottom in March 2009. Since then, it has been in a slow, 16-year recovery, forming a pattern of Higher Lows against this unbreachable resistance.
- Volume Contraction: Volume was declining (or contracting) during the final phases of this consolidation. This is a classic sign of seller exhaustion right before a major breakout.
🚀 2. The Decisive Breakout
In October 2025, this 25-year pattern was shattered:
- The Surge: The stock surged +26.61% in a single month.
- High-Conviction Volume: This move was backed by a massive spike in volume (2.77 Million shares), confirming strong institutional interest and the validity of the breakout.
- The Close: Most importantly, the stock closed firmly above the 25-year trendline, signaling the "lid" has finally been broken.
📊 3. Key Technical Indicators
The underlying momentum supports this new long-term trend:
- RSI: The Relative Strength Index is rising, showing that strong buying momentum is accelerating.
- EMAs: The short-term Exponential Moving Averages are in a "PCO" (Price Crossover) state, confirming the new bullish trend is in effect across timeframes.
🎯 4. Future Scenarios & Key Levels to Watch
This breakout provides a very clear road map.
🐂 The Bullish Case (Confirmation)
- Confirmation: The "gold standard" for a breakout of this magnitude is a successful "re-test." We want to see the price pull back to the old trendline (now new support, around ₹560) and "bounce," confirming the breakout is genuine.
- Target: Once confirmed, the next logical technical price target is ₹787.
🐻 The Bearish Case (Breakout Failure)
- Trigger: If the momentum is not sustained, and the breakout is a "fakeout" (a "bull trap").
- Confirmation: The stock fails to hold its gains and closes back below the broken trendline (around ₹560 support level) on high volume.
- Target: This failure would invalidate the immediate thesis and likely lead to a sharp sell-off.
Disclaimer: This analysis is my personal view & for educational purposes only. They shall not be construed as trade or investment advice. Before making any financial decision, it is imperative that you consult with a qualified financial professional.
Disclaimer
The information and publications are not meant to be, and do not constitute, financial, investment, trading, or other types of advice or recommendations supplied or endorsed by TradingView. Read more in the Terms of Use.