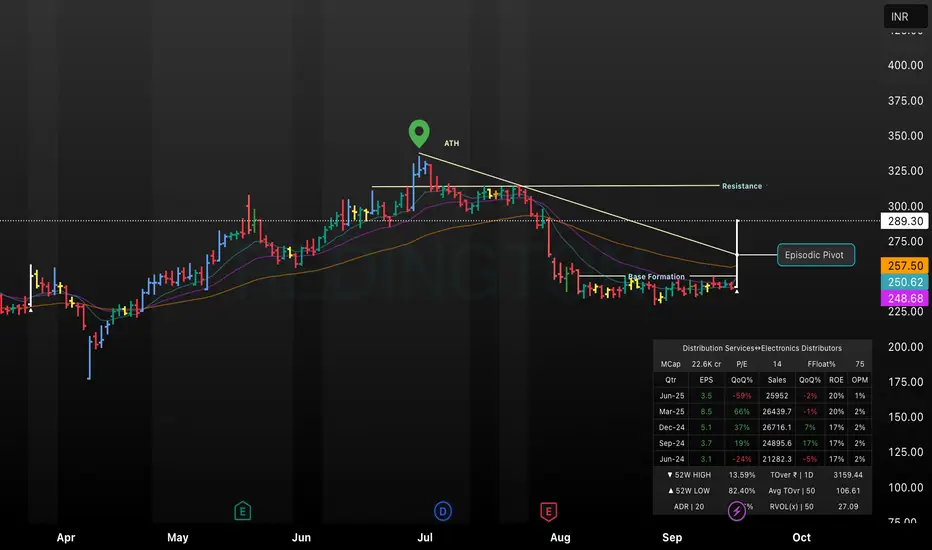
This TradingView chart of REDINGTON illustrates an Episodic Pivot breakout above the resistance zone after a prolonged base formation, marked by a sharp surge in price to ₹289.30 (+19.83%). Key technical indicators and moving averages are shown, alongside annotated zones for resistance, base formation, and All-Time High (ATH). The setup highlights ideal conditions for momentum traders seeking strong episodic price movements.
Disclaimer
The information and publications are not meant to be, and do not constitute, financial, investment, trading, or other types of advice or recommendations supplied or endorsed by TradingView. Read more in the Terms of Use.
Disclaimer
The information and publications are not meant to be, and do not constitute, financial, investment, trading, or other types of advice or recommendations supplied or endorsed by TradingView. Read more in the Terms of Use.