📊 Monthly Pivot Levels (October 2025)
Based on monthly pivot point analysis, key technical levels are as follows:
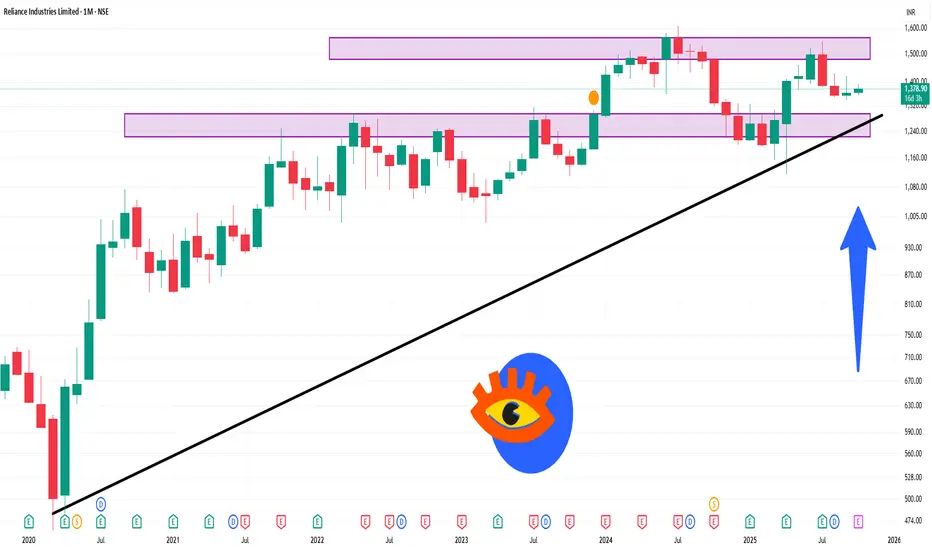
Pivot Point: ₹1,375.53
Resistance Levels: ₹1,410.47 (R1), ₹1,456.93 (R2), ₹1,491.87 (R3)
Support Levels: ₹1,329.07 (S1), ₹1,294.13 (S2), ₹1,247.67 (S3)
The pivot point of ₹1,375.53 indicates a neutral sentiment. Trading above this level may suggest bullish momentum, while trading below it could indicate bearish pressure.
📈 Technical Indicators Summary
RSI (14-day): Approximately 50.55, indicating a neutral market condition.
MACD: 0.190, suggesting a mild bullish trend.
Moving Averages: Neutral outlook with equal buy and sell signals across various timeframes.
Based on monthly pivot point analysis, key technical levels are as follows:
Pivot Point: ₹1,375.53
Resistance Levels: ₹1,410.47 (R1), ₹1,456.93 (R2), ₹1,491.87 (R3)
Support Levels: ₹1,329.07 (S1), ₹1,294.13 (S2), ₹1,247.67 (S3)
The pivot point of ₹1,375.53 indicates a neutral sentiment. Trading above this level may suggest bullish momentum, while trading below it could indicate bearish pressure.
📈 Technical Indicators Summary
RSI (14-day): Approximately 50.55, indicating a neutral market condition.
MACD: 0.190, suggesting a mild bullish trend.
Moving Averages: Neutral outlook with equal buy and sell signals across various timeframes.
Related publications
Disclaimer
The information and publications are not meant to be, and do not constitute, financial, investment, trading, or other types of advice or recommendations supplied or endorsed by TradingView. Read more in the Terms of Use.
Related publications
Disclaimer
The information and publications are not meant to be, and do not constitute, financial, investment, trading, or other types of advice or recommendations supplied or endorsed by TradingView. Read more in the Terms of Use.