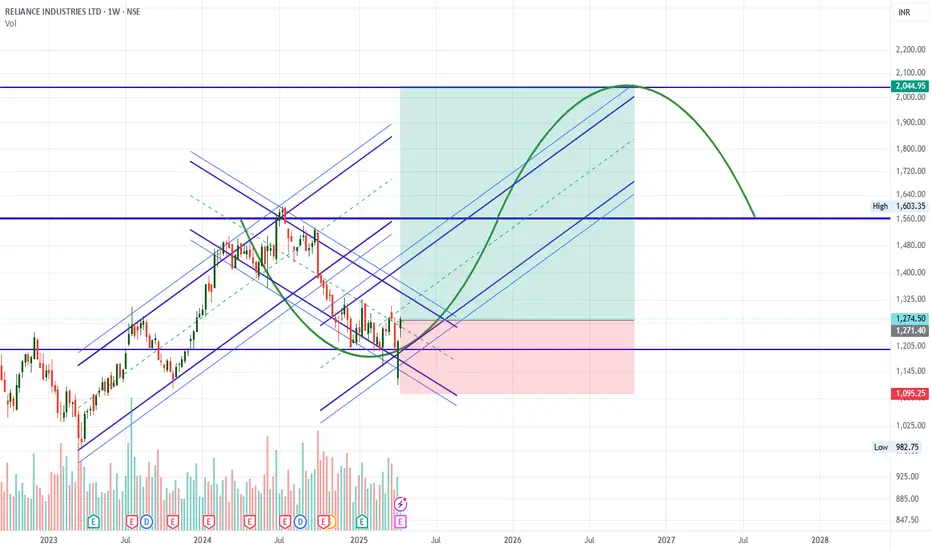
RIL Weekly Chart suggest Bottom formation done - 60% upside possible in next 1.5-2 Years.
LTP - 1275
SL - 1100
Targets - 2050+
Timeframe - 1.5-2 Years.
Happy Investing.
LTP - 1275
SL - 1100
Targets - 2050+
Timeframe - 1.5-2 Years.
Happy Investing.
Disclaimer
The information and publications are not meant to be, and do not constitute, financial, investment, trading, or other types of advice or recommendations supplied or endorsed by TradingView. Read more in the Terms of Use.
Disclaimer
The information and publications are not meant to be, and do not constitute, financial, investment, trading, or other types of advice or recommendations supplied or endorsed by TradingView. Read more in the Terms of Use.