📈 RELIANCE INDUSTRIES LTD – Strong Bullish Breakout!
📅 Date: April 28, 2025
📈 Timeframe: Daily Chart
🔍 Stock: Reliance Industries Ltd (NSE)
📌 Technical Overview:
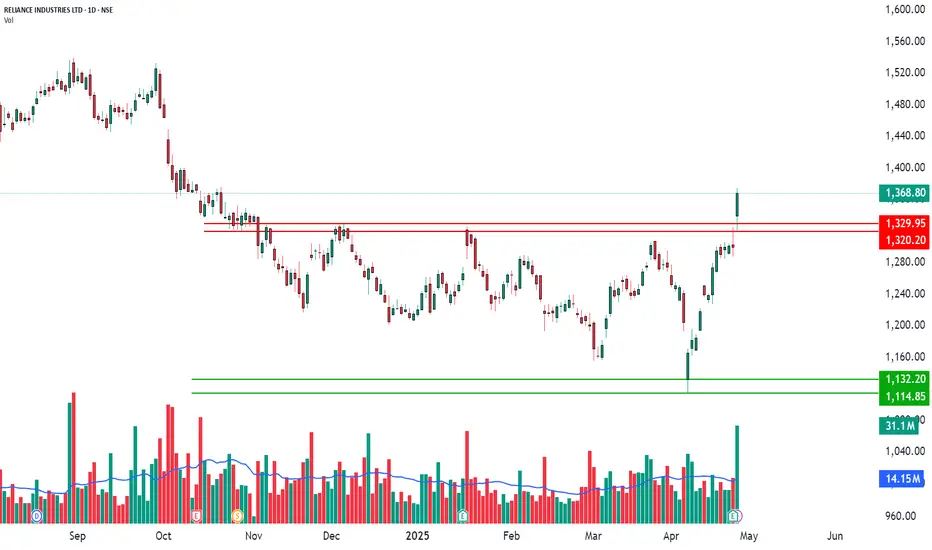
Reliance Industries has shown strong bullish momentum after breaking out above the important level of ₹1300.90.
Several indicators are supporting this breakout:
✅ RSI Breakout – Showing strong strength.
✅ Bollinger Bands Breakout – Price is breaking outside the bands, showing heavy momentum.
✅ Bullish VWAP Trend – Price is trading well above the VWAP line.
✅ TTM Squeeze Breakout – Major squeeze breakout confirms buyers' control.
🧩 Key Levels:
Major Resistance Broken: ₹1300.90 ✅
Immediate Support Now: ₹1329.95 and ₹1320.20 (red lines)
Next Possible Support: ₹1132.20 and ₹1114.85 (green lines, if reversal happens later)
📊 Volume Analysis:
Heavy spike in volume confirming strong buying activity.
🧠 Observational Bias:
As long as the price stays above ₹1300.90, the momentum remains bullish.
Small dips toward support can be seen as healthy pullbacks.
📅 Date: April 28, 2025
📈 Timeframe: Daily Chart
🔍 Stock: Reliance Industries Ltd (NSE)
📌 Technical Overview:
Reliance Industries has shown strong bullish momentum after breaking out above the important level of ₹1300.90.
Several indicators are supporting this breakout:
✅ RSI Breakout – Showing strong strength.
✅ Bollinger Bands Breakout – Price is breaking outside the bands, showing heavy momentum.
✅ Bullish VWAP Trend – Price is trading well above the VWAP line.
✅ TTM Squeeze Breakout – Major squeeze breakout confirms buyers' control.
🧩 Key Levels:
Major Resistance Broken: ₹1300.90 ✅
Immediate Support Now: ₹1329.95 and ₹1320.20 (red lines)
Next Possible Support: ₹1132.20 and ₹1114.85 (green lines, if reversal happens later)
📊 Volume Analysis:
Heavy spike in volume confirming strong buying activity.
🧠 Observational Bias:
As long as the price stays above ₹1300.90, the momentum remains bullish.
Small dips toward support can be seen as healthy pullbacks.
STWP | Mentor & Demand-Supply Specialist | Empowering traders through structured learning |
simpletradewithpatience.com
Community: chat.whatsapp.com/BEYz0tkqP0fJPBCWf59uel
wa.me/message/6IOPHGOXMGZ4N1
Educational Only
simpletradewithpatience.com
Community: chat.whatsapp.com/BEYz0tkqP0fJPBCWf59uel
wa.me/message/6IOPHGOXMGZ4N1
Educational Only
Disclaimer
The information and publications are not meant to be, and do not constitute, financial, investment, trading, or other types of advice or recommendations supplied or endorsed by TradingView. Read more in the Terms of Use.