Potential Long-Term Reversal Zone | Buy on Big Dips Approach
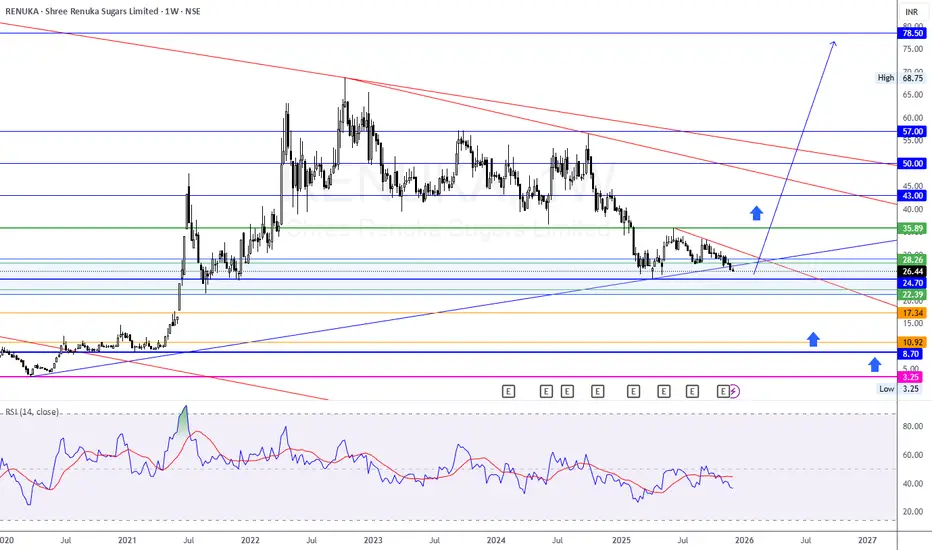
RENuka has been in a prolonged corrective downtrend since the peak around ₹68–70, but price is now testing a significant multi-year support cluster. The stock is trading near demand levels where strong reversals have occurred historically.
🔍 Technical Summary
Current Position
Trading near long-term channel support & horizontal demand zones.
Major support bands lie between ₹28 – 24 – 22
Stronger support zone below lies around ₹17 – 11 – 8
Structure
Price is almost completing a base formation.
Any bullish reversal pattern from here could trigger a strong upside retracement.
RSI is near oversold zone, indicating weakening selling pressure and potential reversal.
🛒 Accumulation / Buy Zones
Zone - Comment
₹28 – 24 - First strong buy zone / reaction expected
₹22 – 17 - Deep correction / highest value zone
₹11 – 8 - Extreme pessimism area – long-term investor zone
📌 Low-risk entries generally happen when price reaches these cycle support levels.
🛡 Stop-loss & Invalid Level
Below ₹5: long-term view invalid & further weakness possible
Historical bottom area ₹3.25 is the absolute support line
Holding above this region supports a reversal structure.
🚀 Upside Target Projections
Target - Area
₹35 – 43 - Initial bounce zone / resistance
₹50 – 57 - Main breakout zone
₹78 – 85 - Long-term target zone if trend reverses
Breakout above ₹43 will be the strongest confirmation of trend reversal.
📈 RSI Commentary
RSI currently hovering near oversold region.
Buying strength increasing on dips.
Previous reversals from similar RSI levels led to strong rallies.
Bias & Strategy
🟢 Primary View: Buy on dips only
Best opportunities occur around ₹28 → ₹24 → ₹22 → ₹17
Long-term bullish only above ₹43
🔴 Alternate View
Close below ₹5 may extend bearish trend significantly.
💬 Question for Followers
Do you see RENuka forming a reversal base or still more downside left?
Comment “Reversal” if bullish or “More Down” if bearish 📩
⚠️ Disclaimer
Educational chart analysis only, not investment advice. Do your own research & risk management.
Disclaimer
The information and publications are not meant to be, and do not constitute, financial, investment, trading, or other types of advice or recommendations supplied or endorsed by TradingView. Read more in the Terms of Use.
Disclaimer
The information and publications are not meant to be, and do not constitute, financial, investment, trading, or other types of advice or recommendations supplied or endorsed by TradingView. Read more in the Terms of Use.