Seizing the $REQ Turnaround: A Detailed 4-Hour Chart Breakdown
Seizing the $REQ Turnaround: A Detailed 4-Hour Chart Breakdown
Price Action Description
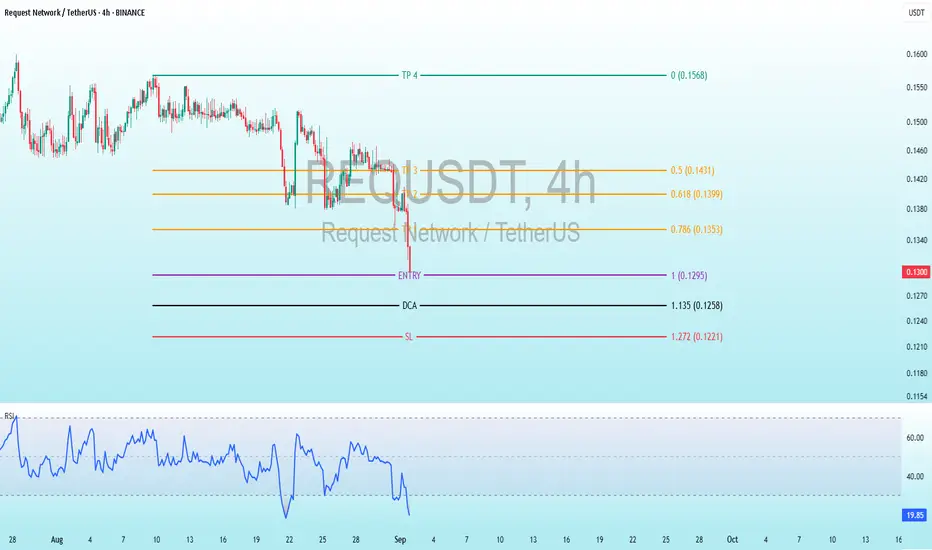
Historical Trend: The price started around 0.18-0.20 USDT in late August, with a gradual decline punctuated by choppy movements. A sharp drop occurred in early September, pushing it toward 0.12-0.13 USDT, followed by a brief recovery attempt.
Recent Movement: A significant red candlestick around September 1 marks a drop from approximately 0.15-0.16 USDT to 0.1297 USDT (current price), suggesting a strong selling pressure or market event. The price has stabilized near this level, with smaller candles indicating potential consolidation.
Current Price: Approximately 0.1297 USDT, down about 20-30% from late August highs, hinting at possible oversold conditions.
Volatility: Moderate to high, as seen in the long wicks and large candle bodies, especially during the recent drop, though volume data is not visible.
Key Technical Levels
Entry: Set at 0.1295 USDT, the suggested point to enter a long position, very close to the current price of 0.1297 USDT, indicating an immediate buy opportunity with minimal pullback expected.
TP (Take Profit): Targets are 0.1786 USDT for the first profit take, followed by 0.1618 USDT, 0.1431 USDT, and the highest goal at 0.1568 USDT, providing a range of exit points for potential gains.
DCA: Positioned at 0.1350 USDT, a level to add to the trade if the price dips slightly, helping to average down the entry cost.
SL (Stop Loss): Placed at 0.1272 USDT, the cutoff to exit the trade if the price falls, limiting losses and protecting the position.
Fibonacci Context: These levels likely stem from a Fibonacci retracement or extension tool applied to the recent drop from 0.18 USDT to 0.1297 USDT, suggesting a potential reversal zone for a long setup.
Risk-Reward: Risk from 0.1295 to 0.1272 is 0.0023 USDT, with rewards to 0.1431 (0.0136, RR 5.9:1) and up to 0.1786 (0.0491, RR ~21.3:1), indicating an exceptionally favorable setup if the bounce materializes.
Indicators Analysis
RSI (Relative Strength Index): Current value is 19.52, below 30, signaling oversold conditions and a potential rebound. The line has trended downward sharply with the recent drop, showing momentum weakening, but no clear bullish divergence yet. The RSI scale (0-100) marks overbought above 70, not relevant here.
Potential Trading Implications and Risks
Bullish Case: The setup suggests a bottom-fishing opportunity post-drop, supported by oversold RSI. A rebound to take-profit levels is plausible if the broader crypto market stabilizes (e.g., Bitcoin trends) or if positive news emerges for Request Network (e.g., adoption updates).
Bearish Case: The recent sharp decline and lack of immediate recovery indicate ongoing selling pressure. Breaking below 0.1272 (SL) could lead to further declines toward 0.12 USDT or lower.
Market Context: As of 11:11 PM CEST on September 1, 2025, check for recent developments—e.g., network upgrades, partnerships, or macro factors like interest rate shifts affecting altcoins.
Risks: Moderate altcoin volatility, lack of volume data (limiting liquidity insight), and subjective Fib levels. Use risk management (e.g., 1-2% account risk).
Suggestions: Confirm with bullish patterns (e.g., hammer) at 0.1295 or RSI crossing above 30.
Trade closed: stop reached
✅MY Free Signals Telegram
t.me/AltcoinPiooners
✅Personal Telegram (Premium)
t.me/Altcoin_Piooners
✅YouTube
youtube.com/@AltcoinPiooners
t.me/AltcoinPiooners
✅Personal Telegram (Premium)
t.me/Altcoin_Piooners
✅YouTube
youtube.com/@AltcoinPiooners
Disclaimer
The information and publications are not meant to be, and do not constitute, financial, investment, trading, or other types of advice or recommendations supplied or endorsed by TradingView. Read more in the Terms of Use.