From Housing Finance Giant to NBFC Phoenix: Why  SAMMAANCAP Breakout Could Signal a Multi-Bagger Opportunity. Let's Analyse in the Chart of the Week.
As per the Latest SEBI Mandate, this isn't a Trading/Investment RECOMMENDATION nor for Educational Purposes; it is just for Informational purposes only. The chart data used is 3 Months old, as Showing Live Chart Data is not allowed according to the New SEBI Mandate.
Disclaimer: "I am not a SEBI REGISTERED RESEARCH ANALYST AND INVESTMENT ADVISER."
This analysis is intended solely for informational purposes and should not be interpreted as financial advice. It is advisable to consult a qualified financial advisor or conduct thorough research before making investment decisions.
Price Action Analysis:
Overall Trend Structure:
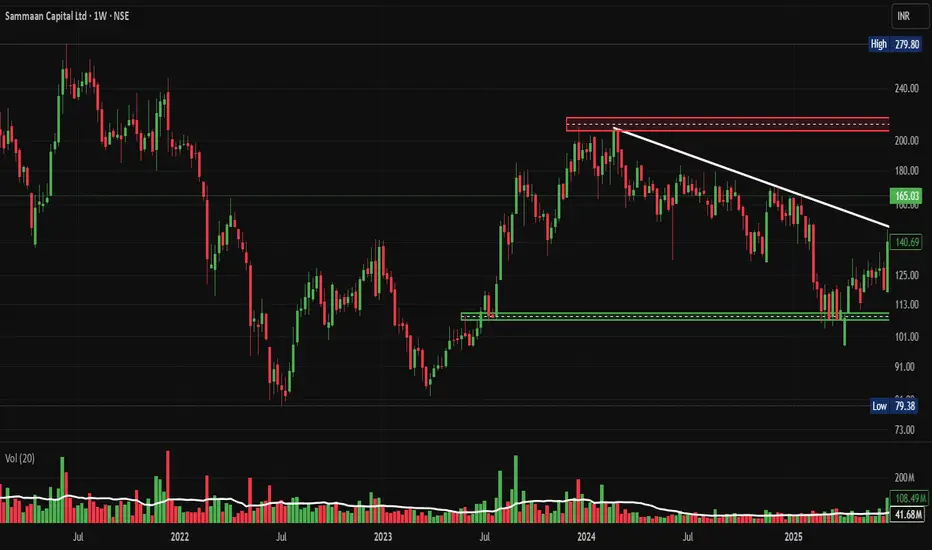
- The stock has been in a prolonged downtrend from its recent high of ₹260 in early 2022
- A major capitulation event occurred in July 2024, creating a panic low at ₹79.38
- Since the July 2024 low, the stock has formed a clear accumulation phase with higher lows
- Recent price action shows a strong breakout from a descending trendline that acted as resistance since early 2024
- Current price at ₹165.03 represents a 107% rally from the lows, indicating strong momentum recovery
Candlestick Patterns & Momentum:
- The most recent weekly candle shows a massive bullish engulfing pattern with a substantial body, suggesting strong buying conviction
- Price has cleared multiple resistance zones with authority, indicating institutional accumulation
- The breakout candle shows no upper wick, demonstrating aggressive buying and a lack of selling pressure at higher levels
- Consecutive green candles in recent weeks suggest sustained buying interest
- The price action exhibits characteristics of a potential trend reversal from bear to bull phase
Moving Averages & Dynamic Support:
- Price has reclaimed all major short-term moving averages
- The stock is now trading above its 50-week moving average
- A golden cross formation appears imminent as shorter-term MAs cross above longer-term MAs
- Previous resistance zones are now expected to act as support on pullbacks
Volume Spread Analysis:
Volume Profile:
- Massive volume spike on the latest breakout candle (462.74M vs average 86.92M) - approximately 5.3x the average volume
- This represents the highest volume since early 2022, indicating significant institutional participation
- Volume during the accumulation phase (July 2024 - September 2025) was relatively subdued, typical of smart money accumulation
- Previous high-volume events coincided with panic selling in 2022 and mid-2024
- Current volume expansion during upward movement is a classic sign of breakout validity
Volume-Price Correlation:
- The price-to-volume ratio shows a healthy correlation during the recent rally
- Higher volume on up days compared to down days indicates bullish sentiment
- The massive volume breakout suggests this move has strong institutional backing
- No signs of distribution (high volume on down days) at current levels
Volume Analysis Inference:
- The 5x volume expansion confirms a genuine breakout rather than a false move
- Smart money appears to be entering positions aggressively
- Retail participation is likely to increase given the media coverage and the F&O ban lifting
- Volume profile supports continuation of the uptrend in the near-term
Key Support & Resistance Levels:
Major Resistance Zones:
- R1 (Immediate): ₹175-180 - Minor psychological resistance
- R2 (Near-term): ₹200-220 - Previous consolidation zone and descending trendline confluence
- R3 (Major): ₹240-260 - Recent high zone with significant supply potential
- R4 (Psychological): ₹300 - Round number psychological barrier
Major Support Zones:
- S1 (Immediate): ₹150-155 - Recent breakout level, now acting as support
- S2 (Strong): ₹135-140 - Multiple touch points and previous resistance turned support
- S3 (Critical): ₹113-120 - Horizontal support zone with high volume node
- S4 (Ultimate): ₹100-105 - Major accumulation zone and swing low area
Key Price Levels to Watch:
- Breakdown level to watch: ₹145 (invalidation of bullish setup)
- Pivotal zone: ₹135-140 (must hold for bullish continuation)
- Stop-loss zone for longs: Below ₹130
Base Formation & Pattern Recognition:
Primary Base Structure:
- The base shows characteristics of a "Stage 1" accumulation base as per the Weinstein methodology
Secondary Patterns Identified:
- Descending Channel: From January 2024 to September 2025, the stock traded within a falling channel
- Breakout Pattern: Recent weekly candle broke above the descending trendline resistance with authority
- Double Bottom: A smaller double bottom formation exists at the ₹100-105 level (June-July 2025)
- Higher Low Sequence: Since the July 2024 bottom, the stock has made consistent higher lows - ₹79, ₹100, ₹130, ₹135
Pattern Implications:
- The quality of base formation (15 months) indicates strong institutional accumulation
Technical Indicators Assessment:
Trend Indicators:
- Price trading above descending trendline for the first time in 18 months
- Structure shifted from lower highs/lower lows to higher highs/higher lows
- Breakout above multi-month resistance confirms trend reversal
- Weekly timeframe showing a clear momentum shift
Volatility Indicators:
- Recent expansion in price range indicates increasing volatility
- Volatility expansion during upward movement is a bullish characteristic
- ATR (Average True Range) is likely expanding, providing better trading opportunities
Diversification Rules:
- Maximum NBFC/Financial sector exposure: 15-20% of portfolio
- Since Sammaan Capital is an NBFC, ensure other NBFC holdings don't exceed the sector limit
- Correlation check: Avoid overweight in stocks moving in tandem
- Rebalance if a single position grows beyond 10% due to appreciation
Risk Management Framework:
Technical Risk Factors:
- Breakout failure risk: 30% probability of pullback to ₹140-150
- False breakout risk: Volume sustenance needed for confirmation
- Resistance rejection risk: ₹220 zone has strong supply potential
- Trend reversal risk: Any weekly close below ₹130 invalidates the bullish thesis
- Volatility risk: NBFC stocks prone to sudden regulatory/news-driven moves
Risk Mitigation Strategies:
- Never invest more than planned position size, even if the setup looks perfect
- Use limit orders instead of market orders to avoid slippage
- Don't average down if SL is hit - accept loss and re-evaluate
- Keep a 30% cash reserve for better entry opportunities
- Use trailing stops religiously once in profit
- Maintain a trading journal to track decisions and learn from mistakes
Portfolio Risk Constraints:
- Maximum drawdown tolerance: 20% on this position
- Overall portfolio heat: Not more than 4-5% at risk across all open positions
- Correlation check: If market corrects 5%, financial stocks may correct 7-8%
- Sector concentration: Limit NBFC exposure even if multiple opportunities arise
- Black swan provision: Always keep an emergency exit plan
Risk Monitoring Checklist:
- Daily: Check if price respects support zones
- Weekly: Review volume patterns and trend integrity
- Monthly: Reassess fundamental drivers and news flow
- Quarterly: Deep-dive into earnings, asset quality, regulatory changes
- Event-driven: Monitor RBI policies, interest rate decisions, sector news
Exit Risk Management:
- Never hold through a major support breakdown, hoping for recovery
- If SL hit, stay away for 2-3 weeks before re-entry consideration
- Avoid revenge trading after the stop-loss trigger
- Book partial profits at predetermined levels - don't get greedy
- If the target is achieved faster than expected, evaluate for signs of exhaustion
Sectoral Analysis - NBFC & Housing Finance:
NBFC Sector Overview:
-SAMMAANCAP is a mortgage-focused non-banking financial company (NBFC) regulated by the Reserve Bank of India (RBI) and rated 'AA' by CRISIL and ICRA
- The NBFC sector has witnessed consolidation over the past 3 years post-COVID disruptions
- The regulatory framework has tightened with the RBI implementing scale-based regulations
- A favourable policy environment exists with a stable macroeconomic backdrop
- Housing finance remains a priority sector with government's push for affordable housing
Current Sector Dynamics:
- Interest rate cycle appears to be stabilising after aggressive hikes in 2022-2023
- Credit growth in retail segments (housing, LAP) remains robust at 15-18% YoY
- Asset quality concerns have moderated across the NBFC sector
- Competition is intensifying with banks offering competitive home loan rates
- Digital transformation and fintech partnerships reshaping distribution
Sector Growth Drivers:
- India's housing demand remains strong, driven by urbanization and nuclear families
- Under-penetrated mortgage market compared to developed economies (10% vs 50-70% mortgage-to-GDP)
- Government schemes like PMAY (Pradhan Mantri Awas Yojana) support affordable housing
- The Loan Against Property (LAP) segment is growing as businesses seek growth capital
- Co-lending arrangements between NBFCs and banks gaining traction
Sector Headwinds:
- Asset-liability management challenges for smaller NBFCs
- Rising cost of funds impacting margins
- Regulatory compliance costs are increasing
- Competition from banks with lower cost of funds
- Economic slowdown risks impacting borrower repayment capacity
Regulatory Environment:
- RBI's scale-based regulation framework implemented in October 2022
- Enhanced monitoring of large NBFCs (asset size >₹10,000 crore)
- Stricter provisioning and capital adequacy norms
- Focus on corporate governance and risk management frameworks
- Recent F&O ban lifting indicates regulatory confidence restoration
Fundamental Analysis:
Business Model & Operations:
- Incorporated in 2005, registered and regulated by the National Housing Bank (NHB), engaged in providing home loans, loans against property, corporate mortgage loans, lease rental discounting, and residential construction finance
- The company has adopted an asset-light business model with a differentiated origination strategy and proven co-lending execution across affordable housing and MSME segments
- Operates with co-lending partnerships - had 10 bank partnerships as of September 2024, with plans to increase to 12 by March 2025
- Product portfolio: Home Loans, Loan Against Property (LAP), Construction Finance, Lease Rental Discounting
Financial Performance Analysis
- Market capitalization: ₹13,670 crore; Revenue: ₹8,947 crore; Current year profit: -₹1,800 crore
- The company has delivered poor sales growth of -8% over the past five years
- Q1 FY26: Reported profit of ₹334 crore on total income of ₹2,400 crore; For FY25, posted loss of -₹1,807 crore on total income of ₹8,676 crore
- Recent profitability turnaround visible in quarterly results suggests business stabilization
- The company has a low interest coverage ratio, indicating higher financial leverage
Recent Corporate Developments:
- Abu Dhabi's IHC (International Holding Company) approved preferential allotment to buy 43.5% stake for ₹8,850 crore through Avenir Investment RSC Ltd, paving the way for IHC to assume promoter status
- This massive foreign investment indicates strong confidence in turnaround story
- Company rebranded from Indiabulls Housing Finance to Sammaan Capital to shed legacy issues
- Credit ratings upgraded by S&P and Moody's changed outlook to 'positive' from 'stable'; retained AA/Stable rating from CRISIL and ICRA
- F&O ban recently lifted, signalling renewed market confidence
Asset Quality & Risk Metrics:
- Assets Under Management of ₹12,777 crore as of September 2024
- Shift towards an asset-light model, reducing balance sheet risk
- Co-lending partnerships diversify risk and improve capital efficiency
- Need to monitor gross NPA and net NPA trends in upcoming quarters
- Provisioning coverage ratio and capital adequacy ratio are key metrics to watch
Valuation Metrics:
- PE ratio currently at 0, indicating the company was loss-making in the recent period
- Market cap growth of 3.48% the last 1 year - recent rally not fully reflected in this data
- Price-to-Book ratio likely attractive given low valuation during the distress period
- Current valuation at ₹165 offers asymmetric risk-reward if turnaround sustains
- Comparable NBFCs trading at 1.5-3x book value; Sammaan could rerate as profitability improves
Management & Corporate Governance:
- Company underwent significant management changes post-rebranding
- Abu Dhabi's IHC taking promoter status brings international credibility
- Focus on transparent reporting and governance improvements post legacy issues
- Strategic shift to asset-light model shows adaptive management
Competitive Position & Market Share:
- Competes with players like HDFC Ltd, LIC Housing Finance, PNB Housing, and Bajaj Housing Finance
- Differentiated strategy focusing on emerging geographies and affordable housing segment
- Co-lending model provides a competitive advantage in a capital-constrained environment
- Brand recall is still building after rebranding from Indiabulls
Key Strengths:
- Strong rating from CRISIL and ICRA (AA/Stable) indicates a robust credit profile
- ₹8,850 crore investment by Abu Dhabi's IHC validates business potential
- Asset-light model reduces capital requirements and improves ROE potential
- Regulatory compliance and risk management frameworks strengthened
- Experienced in affordable housing and MSME lending segments
Key Concerns & Risks:
- Historical loss of ₹1,800 crore in FY25 raises sustainability questions
- Poor revenue growth of -8.08% over 5 years indicates business challenges
- A low interest coverage ratio suggests vulnerability to interest rate volatility
- Ongoing investigations related to past operations remain overhang
- Execution risk in scaling up co-lending partnerships
- Asset quality deterioration risk if economic conditions weaken
Integrated Technical-Fundamental Outlook:
Confluence Factors Supporting Bullish Thesis:
- Technical breakout coinciding with fundamental catalysts (IHC investment, F&O ban lifting)
- Volume expansion confirming institutional interest aligning with ₹8,850 crore IHC investment
- 15-month base formation suggesting strong accumulation by informed investors
- Credit rating upgrades provide fundamental validation to the technical setup
- Quarterly profitability turnaround supporting higher valuation rerating
Scenario Analysis:
Bull Case Scenario
- IHC investment successfully closes and brings operational improvements
- Asset quality remains stable, and profitability is sustained in the upcoming quarters
- Co-lending partnerships expand as planned, driving AUM growth
Base Case Scenario
- Business stabilises with moderate growth in AUM and profitability
- Volatility remains elevated due to sector and stock-specific news
Bear Case Scenario
- Asset quality deterioration or operational challenges emerge
- IHC deal gets delayed or faces regulatory hurdles
- Technical breakdown below ₹145 leads to retest of ₹120-130 zone
- Macro headwinds (RBI policy tightening, economic slowdown) impact the sector
- Exit recommended if the weekly close is below ₹130
Critical Events to Monitor:
Next 3 Months:
- Completion of IHC preferential allotment and fund infusion
- Q2 FY26 earnings (October/November 2025) - profitability sustainability check
- Any regulatory updates or clarifications on past investigations
- Technical retest of ₹150-155 support zone and price reaction
Next 6 Months:
- Q3 FY26 earnings showing consistent profitability
- Expansion of co-lending partnerships (target 12 banks)
- AUM growth trajectory and disbursement trends
- NPA trends and provisioning coverage
- Technical breakout above ₹220 resistance
Next 12 Months:
- Full-year FY26 results demonstrating turnaround completion
- Market share gains in affordable housing and LAP segments
- ROE and ROA improvement trends
- PE multiple rerating towards industry average
Recommended Action Plan:
- Allocate 4-6% of portfolio with strict stop-loss discipline
- Book partial profits
- Trail remaining position
- Monitor quarterly results and credit metrics religiously
- Re-evaluate thesis if any fundamental red flag emerges
My 2 Cents:
The chart presents a textbook example of a turnaround setup with a well-defined 15-month base formation, decisive breakout on exceptional volume (5.3x average), and a clear risk-reward structure. The combination of descending channel breakout and momentum shift from lower lows to higher highs creates a compelling technical narrative.
SAMMAANCAP represents a high-risk, high-reward turnaround play backed by credible fundamental catalysts. The ₹8,850 crore investment by Abu Dhabi's IHC provides a strong validation of intrinsic value. The transition to an asset-light model, credit rating upgrades, and return to quarterly profitability suggest the worst may be behind. However, the legacy of past losses, low interest coverage, and ongoing investigations warrants cautious optimism and strict risk management.
Full Coverage on my Newsletter this Week
Keep in the Watchlist and DOYR.
NO RECO. For Buy/Sell.
📌Thank you for exploring my idea! I hope you found it valuable.
🙏FOLLOW for more
👍BOOST if you found it useful.
✍️COMMENT below with your views.
Meanwhile, check out my other stock ideas on the right side until this trade is activated. I would love your feedback.
As per the Latest SEBI Mandate, this isn't a Trading/Investment RECOMMENDATION nor for Educational Purposes; it is just for Informational purposes only. The chart data used is 3 Months old, as Showing Live Chart Data is not allowed according to the New SEBI Mandate.
Disclaimer: "I am not a SEBI REGISTERED RESEARCH ANALYST AND INVESTMENT ADVISER."
This analysis is intended solely for informational purposes and should not be interpreted as financial advice. It is advisable to consult a qualified financial advisor or conduct thorough research before making investment decisions.
Price Action Analysis:
Overall Trend Structure:
- The stock has been in a prolonged downtrend from its recent high of ₹260 in early 2022
- A major capitulation event occurred in July 2024, creating a panic low at ₹79.38
- Since the July 2024 low, the stock has formed a clear accumulation phase with higher lows
- Recent price action shows a strong breakout from a descending trendline that acted as resistance since early 2024
- Current price at ₹165.03 represents a 107% rally from the lows, indicating strong momentum recovery
Candlestick Patterns & Momentum:
- The most recent weekly candle shows a massive bullish engulfing pattern with a substantial body, suggesting strong buying conviction
- Price has cleared multiple resistance zones with authority, indicating institutional accumulation
- The breakout candle shows no upper wick, demonstrating aggressive buying and a lack of selling pressure at higher levels
- Consecutive green candles in recent weeks suggest sustained buying interest
- The price action exhibits characteristics of a potential trend reversal from bear to bull phase
Moving Averages & Dynamic Support:
- Price has reclaimed all major short-term moving averages
- The stock is now trading above its 50-week moving average
- A golden cross formation appears imminent as shorter-term MAs cross above longer-term MAs
- Previous resistance zones are now expected to act as support on pullbacks
Volume Spread Analysis:
Volume Profile:
- Massive volume spike on the latest breakout candle (462.74M vs average 86.92M) - approximately 5.3x the average volume
- This represents the highest volume since early 2022, indicating significant institutional participation
- Volume during the accumulation phase (July 2024 - September 2025) was relatively subdued, typical of smart money accumulation
- Previous high-volume events coincided with panic selling in 2022 and mid-2024
- Current volume expansion during upward movement is a classic sign of breakout validity
Volume-Price Correlation:
- The price-to-volume ratio shows a healthy correlation during the recent rally
- Higher volume on up days compared to down days indicates bullish sentiment
- The massive volume breakout suggests this move has strong institutional backing
- No signs of distribution (high volume on down days) at current levels
Volume Analysis Inference:
- The 5x volume expansion confirms a genuine breakout rather than a false move
- Smart money appears to be entering positions aggressively
- Retail participation is likely to increase given the media coverage and the F&O ban lifting
- Volume profile supports continuation of the uptrend in the near-term
Key Support & Resistance Levels:
Major Resistance Zones:
- R1 (Immediate): ₹175-180 - Minor psychological resistance
- R2 (Near-term): ₹200-220 - Previous consolidation zone and descending trendline confluence
- R3 (Major): ₹240-260 - Recent high zone with significant supply potential
- R4 (Psychological): ₹300 - Round number psychological barrier
Major Support Zones:
- S1 (Immediate): ₹150-155 - Recent breakout level, now acting as support
- S2 (Strong): ₹135-140 - Multiple touch points and previous resistance turned support
- S3 (Critical): ₹113-120 - Horizontal support zone with high volume node
- S4 (Ultimate): ₹100-105 - Major accumulation zone and swing low area
Key Price Levels to Watch:
- Breakdown level to watch: ₹145 (invalidation of bullish setup)
- Pivotal zone: ₹135-140 (must hold for bullish continuation)
- Stop-loss zone for longs: Below ₹130
Base Formation & Pattern Recognition:
Primary Base Structure:
- The base shows characteristics of a "Stage 1" accumulation base as per the Weinstein methodology
Secondary Patterns Identified:
- Descending Channel: From January 2024 to September 2025, the stock traded within a falling channel
- Breakout Pattern: Recent weekly candle broke above the descending trendline resistance with authority
- Double Bottom: A smaller double bottom formation exists at the ₹100-105 level (June-July 2025)
- Higher Low Sequence: Since the July 2024 bottom, the stock has made consistent higher lows - ₹79, ₹100, ₹130, ₹135
Pattern Implications:
- The quality of base formation (15 months) indicates strong institutional accumulation
Technical Indicators Assessment:
Trend Indicators:
- Price trading above descending trendline for the first time in 18 months
- Structure shifted from lower highs/lower lows to higher highs/higher lows
- Breakout above multi-month resistance confirms trend reversal
- Weekly timeframe showing a clear momentum shift
Volatility Indicators:
- Recent expansion in price range indicates increasing volatility
- Volatility expansion during upward movement is a bullish characteristic
- ATR (Average True Range) is likely expanding, providing better trading opportunities
Diversification Rules:
- Maximum NBFC/Financial sector exposure: 15-20% of portfolio
- Since Sammaan Capital is an NBFC, ensure other NBFC holdings don't exceed the sector limit
- Correlation check: Avoid overweight in stocks moving in tandem
- Rebalance if a single position grows beyond 10% due to appreciation
Risk Management Framework:
Technical Risk Factors:
- Breakout failure risk: 30% probability of pullback to ₹140-150
- False breakout risk: Volume sustenance needed for confirmation
- Resistance rejection risk: ₹220 zone has strong supply potential
- Trend reversal risk: Any weekly close below ₹130 invalidates the bullish thesis
- Volatility risk: NBFC stocks prone to sudden regulatory/news-driven moves
Risk Mitigation Strategies:
- Never invest more than planned position size, even if the setup looks perfect
- Use limit orders instead of market orders to avoid slippage
- Don't average down if SL is hit - accept loss and re-evaluate
- Keep a 30% cash reserve for better entry opportunities
- Use trailing stops religiously once in profit
- Maintain a trading journal to track decisions and learn from mistakes
Portfolio Risk Constraints:
- Maximum drawdown tolerance: 20% on this position
- Overall portfolio heat: Not more than 4-5% at risk across all open positions
- Correlation check: If market corrects 5%, financial stocks may correct 7-8%
- Sector concentration: Limit NBFC exposure even if multiple opportunities arise
- Black swan provision: Always keep an emergency exit plan
Risk Monitoring Checklist:
- Daily: Check if price respects support zones
- Weekly: Review volume patterns and trend integrity
- Monthly: Reassess fundamental drivers and news flow
- Quarterly: Deep-dive into earnings, asset quality, regulatory changes
- Event-driven: Monitor RBI policies, interest rate decisions, sector news
Exit Risk Management:
- Never hold through a major support breakdown, hoping for recovery
- If SL hit, stay away for 2-3 weeks before re-entry consideration
- Avoid revenge trading after the stop-loss trigger
- Book partial profits at predetermined levels - don't get greedy
- If the target is achieved faster than expected, evaluate for signs of exhaustion
Sectoral Analysis - NBFC & Housing Finance:
NBFC Sector Overview:
-
- The NBFC sector has witnessed consolidation over the past 3 years post-COVID disruptions
- The regulatory framework has tightened with the RBI implementing scale-based regulations
- A favourable policy environment exists with a stable macroeconomic backdrop
- Housing finance remains a priority sector with government's push for affordable housing
Current Sector Dynamics:
- Interest rate cycle appears to be stabilising after aggressive hikes in 2022-2023
- Credit growth in retail segments (housing, LAP) remains robust at 15-18% YoY
- Asset quality concerns have moderated across the NBFC sector
- Competition is intensifying with banks offering competitive home loan rates
- Digital transformation and fintech partnerships reshaping distribution
Sector Growth Drivers:
- India's housing demand remains strong, driven by urbanization and nuclear families
- Under-penetrated mortgage market compared to developed economies (10% vs 50-70% mortgage-to-GDP)
- Government schemes like PMAY (Pradhan Mantri Awas Yojana) support affordable housing
- The Loan Against Property (LAP) segment is growing as businesses seek growth capital
- Co-lending arrangements between NBFCs and banks gaining traction
Sector Headwinds:
- Asset-liability management challenges for smaller NBFCs
- Rising cost of funds impacting margins
- Regulatory compliance costs are increasing
- Competition from banks with lower cost of funds
- Economic slowdown risks impacting borrower repayment capacity
Regulatory Environment:
- RBI's scale-based regulation framework implemented in October 2022
- Enhanced monitoring of large NBFCs (asset size >₹10,000 crore)
- Stricter provisioning and capital adequacy norms
- Focus on corporate governance and risk management frameworks
- Recent F&O ban lifting indicates regulatory confidence restoration
Fundamental Analysis:
Business Model & Operations:
- Incorporated in 2005, registered and regulated by the National Housing Bank (NHB), engaged in providing home loans, loans against property, corporate mortgage loans, lease rental discounting, and residential construction finance
- The company has adopted an asset-light business model with a differentiated origination strategy and proven co-lending execution across affordable housing and MSME segments
- Operates with co-lending partnerships - had 10 bank partnerships as of September 2024, with plans to increase to 12 by March 2025
- Product portfolio: Home Loans, Loan Against Property (LAP), Construction Finance, Lease Rental Discounting
Financial Performance Analysis
- Market capitalization: ₹13,670 crore; Revenue: ₹8,947 crore; Current year profit: -₹1,800 crore
- The company has delivered poor sales growth of -8% over the past five years
- Q1 FY26: Reported profit of ₹334 crore on total income of ₹2,400 crore; For FY25, posted loss of -₹1,807 crore on total income of ₹8,676 crore
- Recent profitability turnaround visible in quarterly results suggests business stabilization
- The company has a low interest coverage ratio, indicating higher financial leverage
Recent Corporate Developments:
- Abu Dhabi's IHC (International Holding Company) approved preferential allotment to buy 43.5% stake for ₹8,850 crore through Avenir Investment RSC Ltd, paving the way for IHC to assume promoter status
- This massive foreign investment indicates strong confidence in turnaround story
- Company rebranded from Indiabulls Housing Finance to Sammaan Capital to shed legacy issues
- Credit ratings upgraded by S&P and Moody's changed outlook to 'positive' from 'stable'; retained AA/Stable rating from CRISIL and ICRA
- F&O ban recently lifted, signalling renewed market confidence
Asset Quality & Risk Metrics:
- Assets Under Management of ₹12,777 crore as of September 2024
- Shift towards an asset-light model, reducing balance sheet risk
- Co-lending partnerships diversify risk and improve capital efficiency
- Need to monitor gross NPA and net NPA trends in upcoming quarters
- Provisioning coverage ratio and capital adequacy ratio are key metrics to watch
Valuation Metrics:
- PE ratio currently at 0, indicating the company was loss-making in the recent period
- Market cap growth of 3.48% the last 1 year - recent rally not fully reflected in this data
- Price-to-Book ratio likely attractive given low valuation during the distress period
- Current valuation at ₹165 offers asymmetric risk-reward if turnaround sustains
- Comparable NBFCs trading at 1.5-3x book value; Sammaan could rerate as profitability improves
Management & Corporate Governance:
- Company underwent significant management changes post-rebranding
- Abu Dhabi's IHC taking promoter status brings international credibility
- Focus on transparent reporting and governance improvements post legacy issues
- Strategic shift to asset-light model shows adaptive management
Competitive Position & Market Share:
- Competes with players like HDFC Ltd, LIC Housing Finance, PNB Housing, and Bajaj Housing Finance
- Differentiated strategy focusing on emerging geographies and affordable housing segment
- Co-lending model provides a competitive advantage in a capital-constrained environment
- Brand recall is still building after rebranding from Indiabulls
Key Strengths:
- Strong rating from CRISIL and ICRA (AA/Stable) indicates a robust credit profile
- ₹8,850 crore investment by Abu Dhabi's IHC validates business potential
- Asset-light model reduces capital requirements and improves ROE potential
- Regulatory compliance and risk management frameworks strengthened
- Experienced in affordable housing and MSME lending segments
Key Concerns & Risks:
- Historical loss of ₹1,800 crore in FY25 raises sustainability questions
- Poor revenue growth of -8.08% over 5 years indicates business challenges
- A low interest coverage ratio suggests vulnerability to interest rate volatility
- Ongoing investigations related to past operations remain overhang
- Execution risk in scaling up co-lending partnerships
- Asset quality deterioration risk if economic conditions weaken
Integrated Technical-Fundamental Outlook:
Confluence Factors Supporting Bullish Thesis:
- Technical breakout coinciding with fundamental catalysts (IHC investment, F&O ban lifting)
- Volume expansion confirming institutional interest aligning with ₹8,850 crore IHC investment
- 15-month base formation suggesting strong accumulation by informed investors
- Credit rating upgrades provide fundamental validation to the technical setup
- Quarterly profitability turnaround supporting higher valuation rerating
Scenario Analysis:
Bull Case Scenario
- IHC investment successfully closes and brings operational improvements
- Asset quality remains stable, and profitability is sustained in the upcoming quarters
- Co-lending partnerships expand as planned, driving AUM growth
Base Case Scenario
- Business stabilises with moderate growth in AUM and profitability
- Volatility remains elevated due to sector and stock-specific news
Bear Case Scenario
- Asset quality deterioration or operational challenges emerge
- IHC deal gets delayed or faces regulatory hurdles
- Technical breakdown below ₹145 leads to retest of ₹120-130 zone
- Macro headwinds (RBI policy tightening, economic slowdown) impact the sector
- Exit recommended if the weekly close is below ₹130
Critical Events to Monitor:
Next 3 Months:
- Completion of IHC preferential allotment and fund infusion
- Q2 FY26 earnings (October/November 2025) - profitability sustainability check
- Any regulatory updates or clarifications on past investigations
- Technical retest of ₹150-155 support zone and price reaction
Next 6 Months:
- Q3 FY26 earnings showing consistent profitability
- Expansion of co-lending partnerships (target 12 banks)
- AUM growth trajectory and disbursement trends
- NPA trends and provisioning coverage
- Technical breakout above ₹220 resistance
Next 12 Months:
- Full-year FY26 results demonstrating turnaround completion
- Market share gains in affordable housing and LAP segments
- ROE and ROA improvement trends
- PE multiple rerating towards industry average
Recommended Action Plan:
- Allocate 4-6% of portfolio with strict stop-loss discipline
- Book partial profits
- Trail remaining position
- Monitor quarterly results and credit metrics religiously
- Re-evaluate thesis if any fundamental red flag emerges
My 2 Cents:
The chart presents a textbook example of a turnaround setup with a well-defined 15-month base formation, decisive breakout on exceptional volume (5.3x average), and a clear risk-reward structure. The combination of descending channel breakout and momentum shift from lower lows to higher highs creates a compelling technical narrative.
Full Coverage on my Newsletter this Week
Keep in the Watchlist and DOYR.
NO RECO. For Buy/Sell.
📌Thank you for exploring my idea! I hope you found it valuable.
🙏FOLLOW for more
👍BOOST if you found it useful.
✍️COMMENT below with your views.
Meanwhile, check out my other stock ideas on the right side until this trade is activated. I would love your feedback.
As per the Latest SEBI Mandate, this isn't a Trading/Investment RECOMMENDATION nor for Educational Purposes; it is just for Informational purposes only. The chart data used is 3 Months old, as Showing Live Chart Data is not allowed according to the New SEBI Mandate.
Disclaimer: "I am not a SEBI REGISTERED RESEARCH ANALYST AND INVESTMENT ADVISER."
This analysis is intended solely for informational purposes and should not be interpreted as financial advice. It is advisable to consult a qualified financial advisor or conduct thorough research before making investment decisions.
Related publications
Disclaimer
The information and publications are not meant to be, and do not constitute, financial, investment, trading, or other types of advice or recommendations supplied or endorsed by TradingView. Read more in the Terms of Use.
Related publications
Disclaimer
The information and publications are not meant to be, and do not constitute, financial, investment, trading, or other types of advice or recommendations supplied or endorsed by TradingView. Read more in the Terms of Use.