📉 Weekly Technical Overview (as of Sep 26, 2025)
Current Level: Approximately 80,782.73 points
Weekly Decline: ~2,000 points, reflecting a drop of about 2.35%
Technical Indicators:
Relative Strength Index (RSI): The RSI is currently in the oversold zone, indicating potential for a short-term rebound if buying interest returns
Moving Averages: Technical analysis suggests a bearish trend, with moving averages signaling a "strong sell" outlook
Pivot Points: Key support and resistance levels are being closely monitored to gauge potential reversal points
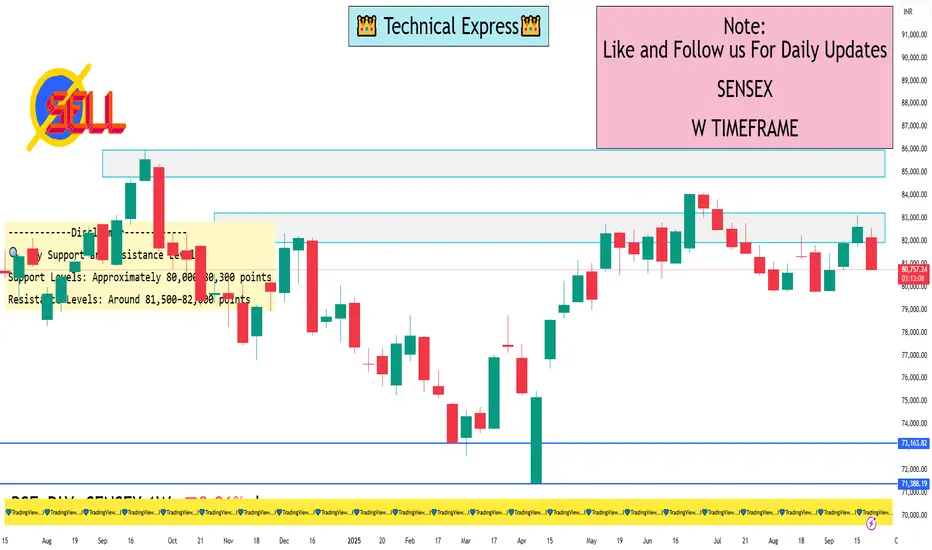
🔍 Key Support and Resistance Levels
Support Levels: Approximately 80,000–80,300 points
Resistance Levels: Around 81,500–82,000 points
These levels are crucial for determining the market's short-term direction. A break below support may indicate further downside, while a move above resistance could signal a potential recovery.
📈 Outlook
While the short-term technical indicators suggest a bearish trend, the oversold conditions and key support levels imply that the market may be due for a corrective bounce. However, the ongoing geopolitical tensions and trade-related uncertainties could continue to exert downward pressure on the index.
Investors are advised to monitor the upcoming trading sessions closely, as a decisive move above or below the established support and resistance levels could provide clearer signals for the next phase of market movement.
Current Level: Approximately 80,782.73 points
Weekly Decline: ~2,000 points, reflecting a drop of about 2.35%
Technical Indicators:
Relative Strength Index (RSI): The RSI is currently in the oversold zone, indicating potential for a short-term rebound if buying interest returns
Moving Averages: Technical analysis suggests a bearish trend, with moving averages signaling a "strong sell" outlook
Pivot Points: Key support and resistance levels are being closely monitored to gauge potential reversal points
🔍 Key Support and Resistance Levels
Support Levels: Approximately 80,000–80,300 points
Resistance Levels: Around 81,500–82,000 points
These levels are crucial for determining the market's short-term direction. A break below support may indicate further downside, while a move above resistance could signal a potential recovery.
📈 Outlook
While the short-term technical indicators suggest a bearish trend, the oversold conditions and key support levels imply that the market may be due for a corrective bounce. However, the ongoing geopolitical tensions and trade-related uncertainties could continue to exert downward pressure on the index.
Investors are advised to monitor the upcoming trading sessions closely, as a decisive move above or below the established support and resistance levels could provide clearer signals for the next phase of market movement.
I built a Buy & Sell Signal Indicator with 85% accuracy.
📈 Get access via DM or
WhatsApp: wa.link/d997q0
Contact - +91 76782 40962
| Email: techncialexpress@gmail.com
| Script Coder | Trader | Investor | From India
📈 Get access via DM or
WhatsApp: wa.link/d997q0
Contact - +91 76782 40962
| Email: techncialexpress@gmail.com
| Script Coder | Trader | Investor | From India
Related publications
Disclaimer
The information and publications are not meant to be, and do not constitute, financial, investment, trading, or other types of advice or recommendations supplied or endorsed by TradingView. Read more in the Terms of Use.