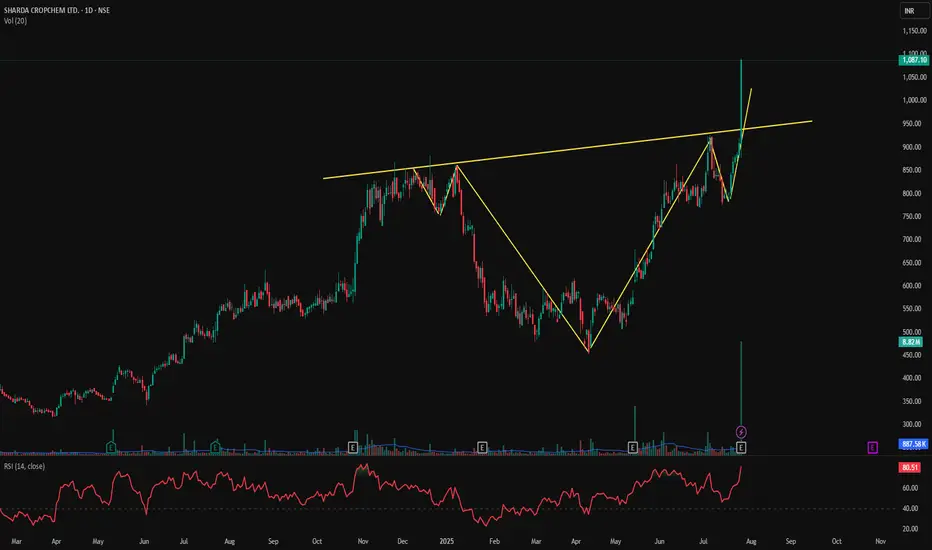
📊 SHARDACROP – Cup & Handle Breakout with Explosive Volume | RSI > 80
📅 Chart Date: July 26, 2025
📍 CMP: ₹1,087.10 (+19.63%)
📈 Symbol: NSE:SHARDACROP | 1D Timeframe
🔍 Technical Analysis Breakdown
☕ Cup and Handle Breakout
A clear Cup and Handle formation has completed.
Breakout above the neckline (~₹940) with a massive bullish candle.
💥 Volume Spike
Volume surged to 8.82M, against the 20-day average of ~887K — institutional buying visible.
This is the highest volume in months, confirming the breakout strength.
📈 RSI (14, close): 80.51
Momentum is extremely strong, entering the overbought zone — may signal continuation or short-term pullback before resuming rally.
📌 Breakout Level: ₹940
📌 Immediate Resistance: ₹1,100–₹1,150
📌 Support on Retest: ₹940–₹960
🎯 Trade Setup
Entry on Retest: ₹960–₹980
Stoploss: ₹920 (below handle base)
Target: ₹1,150 / ₹1,200+
Risk Level: Moderate–High (due to RSI overbought, but pattern is strong)
⚠️ Disclaimer: This is an educational chart setup and not trading advice. Please conduct your own research and risk management.
📣 Follow @PriceAction_Pulse for more such clean breakouts and chart pattern analysis!
🔁 Drop a comment if SHARDACROP is on your radar for the next breakout rally 📈
Trade closed: target reached
The first resistance level has been touched. If the trend is to continue, it's important to follow a trailing stop-loss strategy and patiently wait for the price to approach the second resistance level.Disclaimer
The information and publications are not meant to be, and do not constitute, financial, investment, trading, or other types of advice or recommendations supplied or endorsed by TradingView. Read more in the Terms of Use.
Disclaimer
The information and publications are not meant to be, and do not constitute, financial, investment, trading, or other types of advice or recommendations supplied or endorsed by TradingView. Read more in the Terms of Use.