Share India Securities Ltd.
1. -----Company Technical Analysis Data
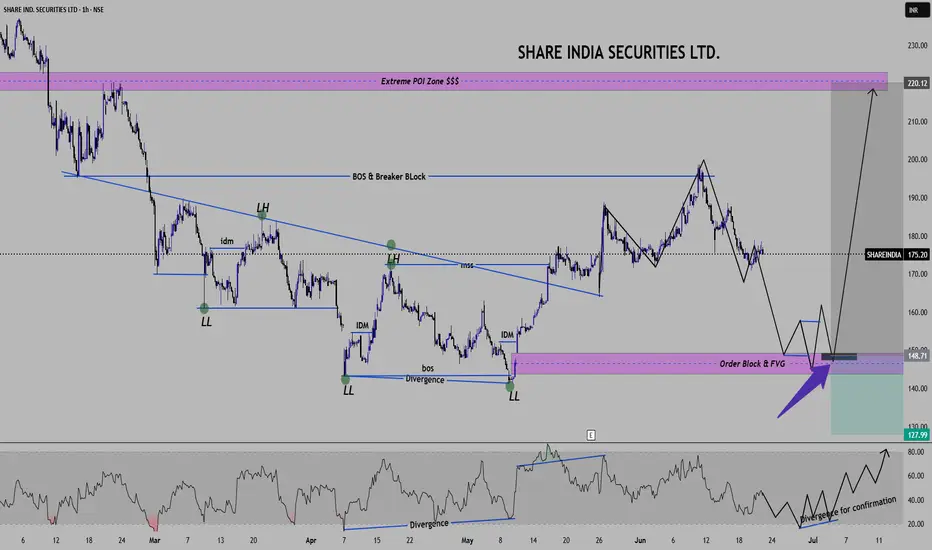
Analysis -- Based on ICT and SMC Concepts
TIME Frame -- 1 hour
Chart Elements & Observations ----
Market Structure -- 1. Clear bearish structure earlier with Lower Lows(LL) and Lower High(LH).
-- 2. Market Structure Shift (MSS) observed which indicates a possible reversal
-- 3. BOS(Break of structure) confirms shift from bearish to bullish bias.
Short Term Outlook (3-6 Weeks) ---
-- Price is currently retracing after recent high (190 levels)
-- We are projecting price to move down to the demand zone @150-160 levels followed by accumulation and reversal.
-- Short term plan is just watch price around 145-150, if price forms a liquidity sweep + Bullish structure then
this is a potential buy Zone.
-- RSI confirmation will strengthen this zone (here we will look for bullish divergence again.)
Short term trade plan -- Buy zone - 145-150 (after confirmation Liq. sweep, bullish engulfing candle and OB Tap)
Stop Loss - 135--138 (Liquidity Below demand)
Target -1 ---- 175 (Retest structure)
Target -2 ---- 190 (Recent High),
Target -3 -----220 (Extreme Liquidity Zone)
Keep note that ----- If price 148-145 demand zone fails then next Higher Time Frame demand may come near 135 levels.
All Traders and Market Influencers, Your Views or comments are most welcomed. Thank You.
==============================================================================
[Disclaimer ----- This analysis is just made for educational purpose for backtesting only. Do not consider it as any investment idea.
Consult your Financial Advisor before any investment.]
1. -----Company Technical Analysis Data
Analysis -- Based on ICT and SMC Concepts
TIME Frame -- 1 hour
Chart Elements & Observations ----
Market Structure -- 1. Clear bearish structure earlier with Lower Lows(LL) and Lower High(LH).
-- 2. Market Structure Shift (MSS) observed which indicates a possible reversal
-- 3. BOS(Break of structure) confirms shift from bearish to bullish bias.
Short Term Outlook (3-6 Weeks) ---
-- Price is currently retracing after recent high (190 levels)
-- We are projecting price to move down to the demand zone @150-160 levels followed by accumulation and reversal.
-- Short term plan is just watch price around 145-150, if price forms a liquidity sweep + Bullish structure then
this is a potential buy Zone.
-- RSI confirmation will strengthen this zone (here we will look for bullish divergence again.)
Short term trade plan -- Buy zone - 145-150 (after confirmation Liq. sweep, bullish engulfing candle and OB Tap)
Stop Loss - 135--138 (Liquidity Below demand)
Target -1 ---- 175 (Retest structure)
Target -2 ---- 190 (Recent High),
Target -3 -----220 (Extreme Liquidity Zone)
Keep note that ----- If price 148-145 demand zone fails then next Higher Time Frame demand may come near 135 levels.
All Traders and Market Influencers, Your Views or comments are most welcomed. Thank You.
==============================================================================
[Disclaimer ----- This analysis is just made for educational purpose for backtesting only. Do not consider it as any investment idea.
Consult your Financial Advisor before any investment.]
Related publications
Disclaimer
The information and publications are not meant to be, and do not constitute, financial, investment, trading, or other types of advice or recommendations supplied or endorsed by TradingView. Read more in the Terms of Use.
Related publications
Disclaimer
The information and publications are not meant to be, and do not constitute, financial, investment, trading, or other types of advice or recommendations supplied or endorsed by TradingView. Read more in the Terms of Use.